Canada - Root Or Tuber Harvesting Machines - Market Analysis, Forecast, Size, Trends and Insights
Get instant access to more than 2 million reports, dashboards, and datasets on the IndexBox Platform.
View PricingCanada Sees a 14% Increase in Agricultural Equipment Imports, Totaling $29 Million in 2023
Canada Harvesting Machinery Imports
In 2023, the amount of root or tuber harvesting machines imported into Canada totaled 357 units, growing by 7.5% against the previous year's figure. Over the period under review, imports continue to indicate a perceptible increase. The pace of growth was the most pronounced in 2018 with an increase of 98%. Imports peaked at 429 units in 2021; however, from 2022 to 2023, imports remained at a lower figure.
In value terms, harvesting machinery imports stood at $29M (IndexBox estimates) in 2023. Overall, imports saw a pronounced expansion. The pace of growth was the most pronounced in 2018 with an increase of 100% against the previous year. Over the period under review, imports hit record highs at $31M in 2021; however, from 2022 to 2023, imports stood at a somewhat lower figure.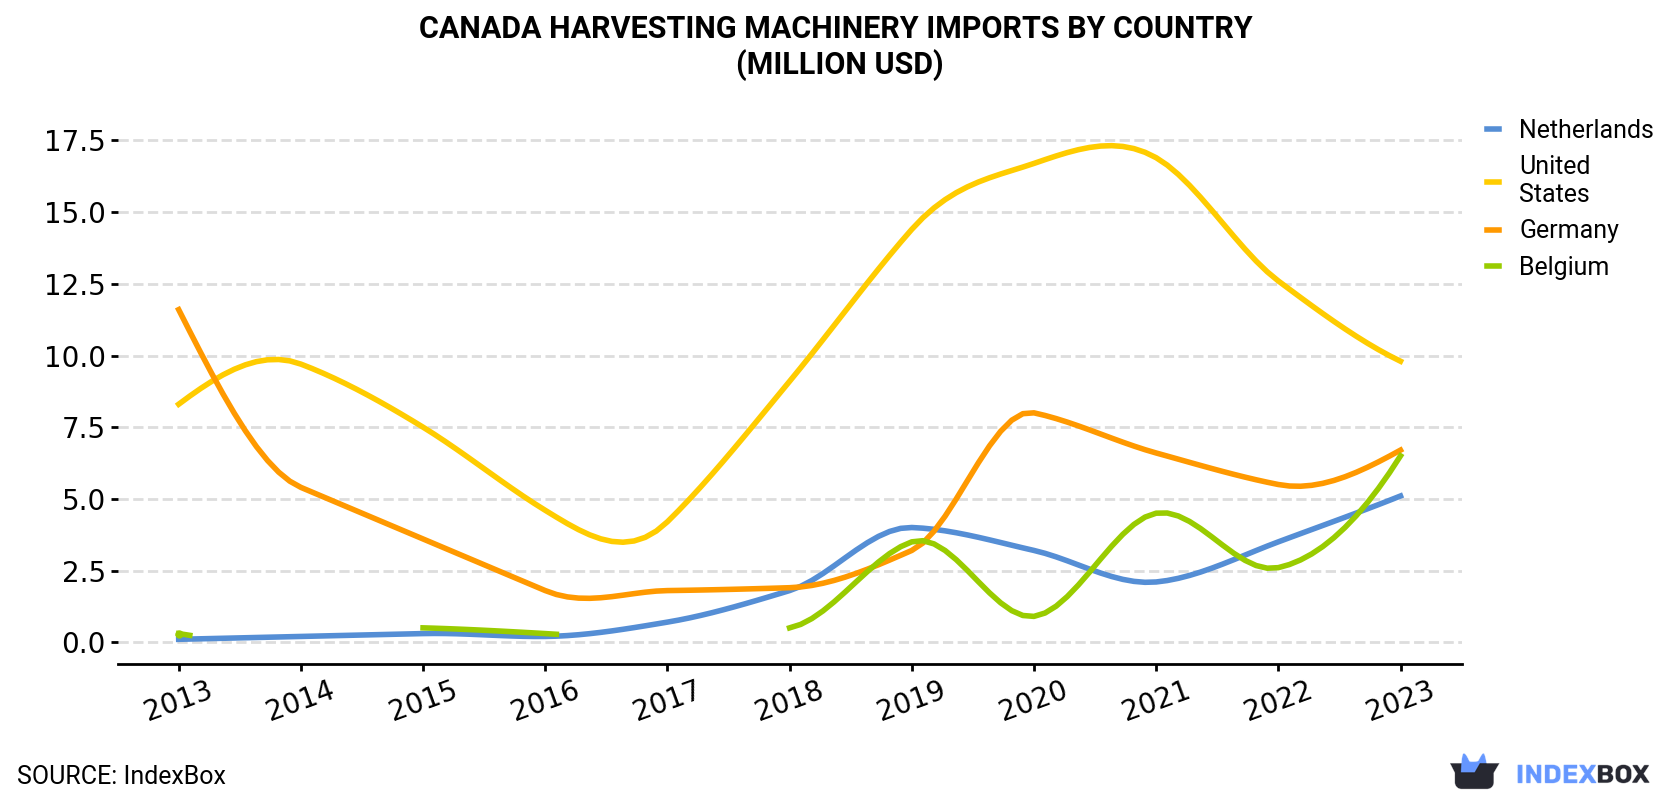
| COUNTRY | Import Value of Harvesting Machinery in Canada (million USD) | ||||||||||
|---|---|---|---|---|---|---|---|---|---|---|---|
| 2013 | 2014 | 2015 | 2016 | 2017 | 2018 | 2019 | 2020 | 2021 | 2022 | 2023 | |
| United States | 8.3 | 9.7 | 7.5 | 4.6 | 4.2 | 9.1 | 14.4 | 16.7 | 16.9 | 12.6 | 9.8 |
| Germany | 11.6 | 5.4 | 3.6 | 1.8 | 1.8 | 1.9 | 3.2 | 8.0 | 6.6 | 5.5 | 6.7 |
| Belgium | 0.3 | N/A | 0.5 | 0.3 | N/A | 0.5 | 3.5 | 0.9 | 4.5 | 2.6 | 6.5 |
| Netherlands | 0.1 | 0.2 | 0.3 | 0.2 | 0.7 | 1.8 | 4.0 | 3.2 | 2.1 | 3.5 | 5.1 |
| Others | 0.8 | 0.3 | 0.2 | 0.2 | 0.5 | 1.3 | 1.2 | 0.7 | 0.7 | 1.1 | 0.7 |
| Total | 21.0 | 15.6 | 12.2 | 7.1 | 7.3 | 14.6 | 26.2 | 29.4 | 30.8 | 25.3 | 28.8 |
Imports by Country
the United States (120 units), Germany (82 units) and Belgium (80 units) were the main suppliers of harvesting machinery imports to Canada, together comprising 79% of total imports. the Netherlands lagged somewhat behind, accounting for a further 18%.
From 2013 to 2023, the most notable rate of growth in terms of purchases, amongst the main suppliers, was attained by the Netherlands (with a CAGR of +51.3%), while imports for the other leaders experienced more modest paces of growth.
In value terms, the largest harvesting machinery suppliers to Canada were the United States ($9.8M), Germany ($6.7M) and Belgium ($6.5M), together accounting for 80% of total imports. These countries were followed by the Netherlands, which accounted for a further 18%.
the Netherlands, with a CAGR of +57.9%, saw the highest rates of growth with regard to the value of imports, among the main suppliers over the period under review, while purchases for the other leaders experienced more modest paces of growth.
Import Prices by Country
In 2023, the harvesting machinery price amounted to $80,663 per unit (CIF, Canada), growing by 6% against the previous year. Over the period under review, the import price continues to indicate a modest increase. The growth pace was the most rapid in 2014 when the average import price increased by 9.4% against the previous year. Over the period under review, average import prices reached the peak figure at $83,872 per unit in 2018; however, from 2019 to 2023, import prices remained at a lower figure.
Average prices varied noticeably amongst the major supplying countries. In 2023, amid the top importers, the countries with the highest prices were Germany ($81,718 per unit) and Belgium ($81,511 per unit), while the price for the Netherlands ($80,974 per unit) and the United States ($81,317 per unit) were amongst the lowest.
From 2013 to 2023, the most notable rate of growth in terms of prices was attained by the Netherlands (+4.4%), while the prices for the other major suppliers experienced more modest paces of growth.
This report provides an in-depth analysis of the harvesting machinery market in Canada. Within it, you will discover the latest data on market trends and opportunities by country, consumption, production and price developments, as well as the global trade (imports and exports). The forecast exhibits the market prospects through 2030.
Product coverage:
- Prodcom 28305420 - Potato-diggers and potato harvesters
- Prodcom 28305450 - Beet-topping machines and beet harvesters
- Prodcom 28305480 - Root or tuber harvesting machines (excluding potato-diggers and potato harvesters, beet-topping machines and beet harvesters)
Country coverage:
- Canada
Data coverage:
- Market volume and value
- Per Capita consumption
- Forecast of the market dynamics in the medium term
- Trade (exports and imports) in Canada
- Export and import prices
- Market trends, drivers and restraints
- Key market players and their profiles
Reasons to buy this report:
- Take advantage of the latest data
- Find deeper insights into current market developments
- Discover vital success factors affecting the market
This report is designed for manufacturers, distributors, importers, and wholesalers, as well as for investors, consultants and advisors.
In this report, you can find information that helps you to make informed decisions on the following issues:
- How to diversify your business and benefit from new market opportunities
- How to load your idle production capacity
- How to boost your sales on overseas markets
- How to increase your profit margins
- How to make your supply chain more sustainable
- How to reduce your production and supply chain costs
- How to outsource production to other countries
- How to prepare your business for global expansion
While doing this research, we combine the accumulated expertise of our analysts and the capabilities of artificial intelligence. The AI-based platform, developed by our data scientists, constitutes the key working tool for business analysts, empowering them to discover deep insights and ideas from the marketing data.
-
1. INTRODUCTION
Making Data-Driven Decisions to Grow Your Business
- REPORT DESCRIPTION
- RESEARCH METHODOLOGY AND AI PLATFORM
- DATA-DRIVEN DECISIONS FOR YOUR BUSINESS
- GLOSSARY AND SPECIFIC TERMS
-
2. EXECUTIVE SUMMARY
A Quick Overview of Market Performance
- KEY FINDINGS
- MARKET TRENDS This Chapter is Available Only for the Professional Edition PRO
-
3. MARKET OVERVIEW
Understanding the Current State of The Market and Its Prospects
- MARKET SIZE
- MARKET STRUCTURE
- TRADE BALANCE
- PER CAPITA CONSUMPTION
- MARKET FORECAST TO 2030
-
4. MOST PROMISING PRODUCT
Finding New Products to Diversify Your Business
This Chapter is Available Only for the Professional Edition PRO- TOP PRODUCTS TO DIVERSIFY YOUR BUSINESS
- BEST-SELLING PRODUCTS
- MOST CONSUMED PRODUCT
- MOST TRADED PRODUCT
- MOST PROFITABLE PRODUCT FOR EXPORT
-
5. MOST PROMISING SUPPLYING COUNTRIES
Choosing the Best Countries to Establish Your Sustainable Supply Chain
This Chapter is Available Only for the Professional Edition PRO- TOP COUNTRIES TO SOURCE YOUR PRODUCT
- TOP PRODUCING COUNTRIES
- TOP EXPORTING COUNTRIES
- LOW-COST EXPORTING COUNTRIES
-
6. MOST PROMISING OVERSEAS MARKETS
Choosing the Best Countries to Boost Your Exports
This Chapter is Available Only for the Professional Edition PRO- TOP OVERSEAS MARKETS FOR EXPORTING YOUR PRODUCT
- TOP CONSUMING MARKETS
- UNSATURATED MARKETS
- TOP IMPORTING MARKETS
- MOST PROFITABLE MARKETS
7. PRODUCTION
The Latest Trends and Insights into The Industry
- PRODUCTION VOLUME AND VALUE
8. IMPORTS
The Largest Import Supplying Countries
- IMPORTS FROM 2012–2023
- IMPORTS BY COUNTRY
- IMPORT PRICES BY COUNTRY
9. EXPORTS
The Largest Destinations for Exports
- EXPORTS FROM 2012–2023
- EXPORTS BY COUNTRY
- EXPORT PRICES BY COUNTRY
-
10. PROFILES OF MAJOR PRODUCERS
The Largest Producers on The Market and Their Profiles
This Chapter is Available Only for the Professional Edition PRO -
LIST OF TABLES
- Key Findings In 2023
- Market Volume, In Physical Terms, 2012–2023
- Market Value, 2012–2023
- Per Capita Consumption In 2012-2023
- Imports, In Physical Terms, By Country, 2012–2023
- Imports, In Value Terms, By Country, 2012–2023
- Import Prices, By Country Of Origin, 2012–2023
- Exports, In Physical Terms, By Country, 2012–2023
- Exports, In Value Terms, By Country, 2012–2023
- Export Prices, By Country Of Destination, 2012–2023
-
LIST OF FIGURES
- Market Volume, In Physical Terms, 2012–2023
- Market Value, 2012–2023
- Market Structure – Domestic Supply vs. Imports, In Physical Terms, 2012-2023
- Market Structure – Domestic Supply vs. Imports, In Value Terms, 2012-2023
- Trade Balance, In Physical Terms, 2012-2023
- Trade Balance, In Value Terms, 2012-2023
- Per Capita Consumption, 2012-2023
- Market Volume Forecast to 2030
- Market Value Forecast to 2030
- Products: Market Size And Growth, By Type
- Products: Average Per Capita Consumption, By Type
- Products: Exports And Growth, By Type
- Products: Export Prices And Growth, By Type
- Production Volume And Growth
- Exports And Growth
- Export Prices And Growth
- Market Size And Growth
- Per Capita Consumption
- Imports And Growth
- Import Prices
- Production, In Physical Terms, 2012–2023
- Production, In Value Terms, 2012–2023
- Imports, In Physical Terms, 2012–2023
- Imports, In Value Terms, 2012–2023
- Imports, In Physical Terms, By Country, 2023
- Imports, In Physical Terms, By Country, 2012–2023
- Imports, In Value Terms, By Country, 2012–2023
- Import Prices, By Country Of Origin, 2012–2023
- Exports, In Physical Terms, 2012–2023
- Exports, In Value Terms, 2012–2023
- Exports, In Physical Terms, By Country, 2023
- Exports, In Physical Terms, By Country, 2012–2023
- Exports, In Value Terms, By Country, 2012–2023
- Export Prices, By Country Of Destination, 2012–2023


