
China - Pianos And Other Keyboard Stringed Musical Instruments - Market Analysis, Forecast, Size, Trends and Insights
Get instant access to more than 2 million reports, dashboards, and datasets on the IndexBox Platform.
View PricingChinese Imports of Pianos Decrease Slightly to $197M in 2023
China Piano Imports
In 2023, the amount of pianos and other keyboard stringed musical instruments imported into China contracted notably to 100K units, with a decrease of -30.2% against the year before. In general, imports recorded a slight descent. The most prominent rate of growth was recorded in 2018 when imports increased by 126%. Over the period under review, imports attained the maximum at 199K units in 2019; however, from 2020 to 2023, imports stood at a somewhat lower figure.
In value terms, piano imports contracted to $197M (IndexBox estimates) in 2023. Overall, total imports indicated perceptible growth from 2013 to 2023: its value increased at an average annual rate of +4.4% over the last decade. The trend pattern, however, indicated some noticeable fluctuations being recorded throughout the analyzed period. Based on 2023 figures, imports decreased by -27.5% against 2021 indices. The growth pace was the most rapid in 2021 when imports increased by 25%. As a result, imports reached the peak of $272M. From 2022 to 2023, the growth of imports failed to regain momentum.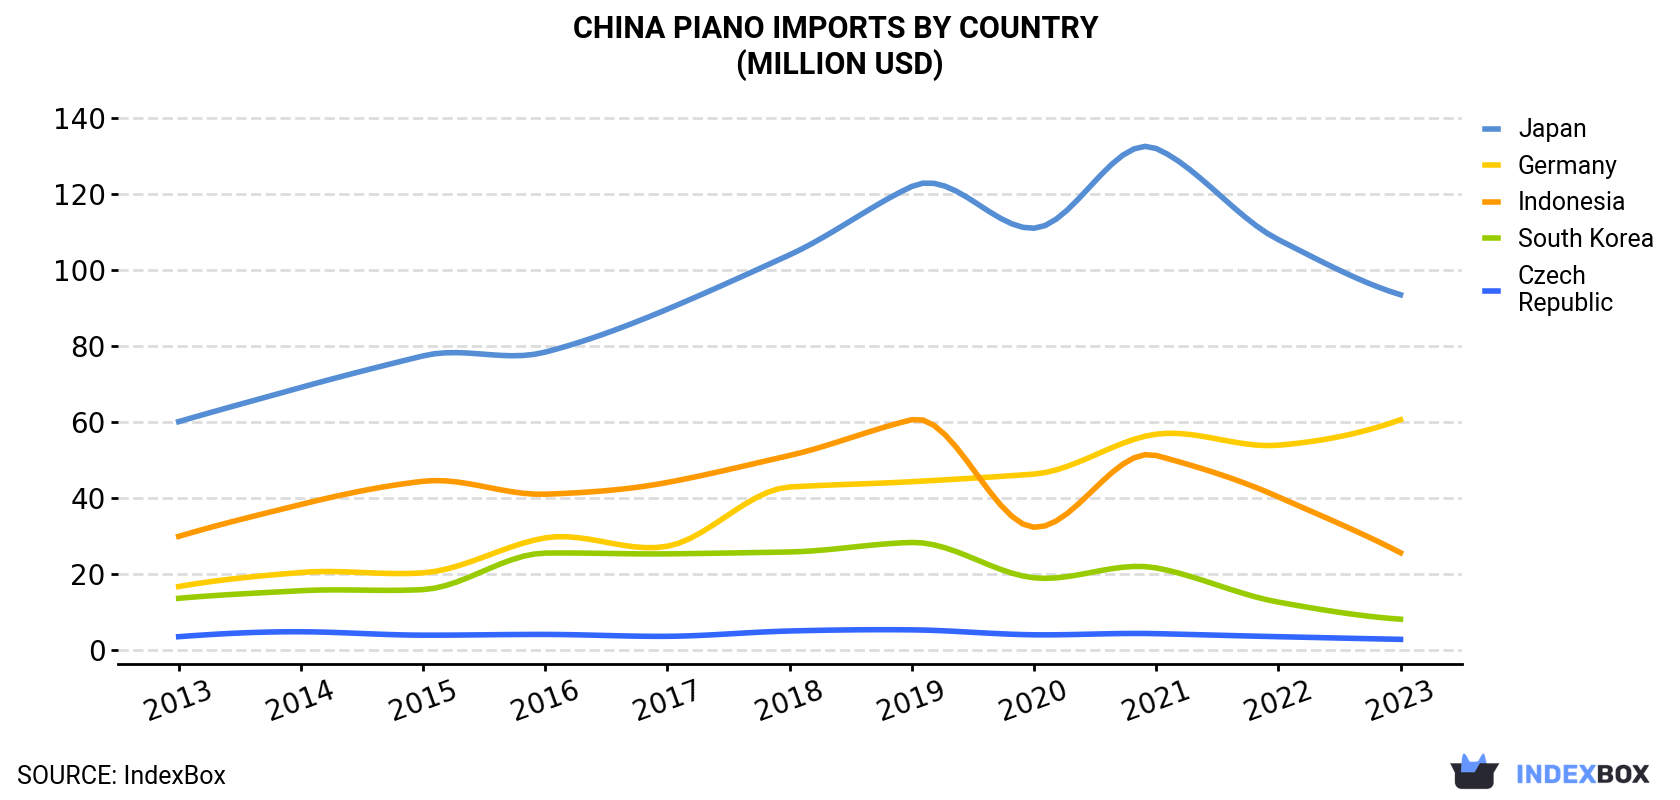
| COUNTRY | Import Value of Piano in China (million USD) | ||||||||||
|---|---|---|---|---|---|---|---|---|---|---|---|
| 2013 | 2014 | 2015 | 2016 | 2017 | 2018 | 2019 | 2020 | 2021 | 2022 | 2023 | |
| Japan | 60.1 | 69.1 | 77.4 | 78.4 | 89.7 | 104 | 122 | 111 | 132 | 108 | 93.5 |
| Germany | 16.7 | 20.4 | 20.3 | 29.5 | 27.3 | 42.9 | 44.3 | 46.3 | 56.8 | 53.9 | 60.6 |
| Indonesia | 29.9 | 38.3 | 44.4 | 41.0 | 44.1 | 51.2 | 60.6 | 32.3 | 51.2 | 40.3 | 25.6 |
| South Korea | 13.6 | 15.6 | 15.9 | 25.5 | 25.3 | 25.8 | 28.3 | 19.0 | 21.6 | 12.6 | 8.1 |
| Czech Republic | 3.5 | 4.8 | 3.9 | 4.1 | 3.6 | 5.0 | 5.3 | 4.0 | 4.3 | 3.5 | 2.8 |
| Others | 4.3 | 3.7 | 6.4 | 4.3 | 8.7 | 7.6 | 8.4 | 4.8 | 6.1 | 5.8 | 6.6 |
| Total | 128 | 152 | 168 | 183 | 199 | 237 | 269 | 218 | 272 | 224 | 197 |
Imports by Country
Japan (53K units), South Korea (36K units) and Indonesia (8.6K units) were the main suppliers of piano imports to China, with a combined 98% share of total imports. Germany and the Czech Republic lagged somewhat behind, together accounting for a further 1.7%.
From 2013 to 2023, the most notable rate of growth in terms of purchases, amongst the main suppliers, was attained by Germany (with a CAGR of +2.9%), while imports for the other leaders experienced a decline.
In value terms, Japan ($93M), Germany ($61M) and Indonesia ($26M) appeared to be the largest piano suppliers to China, together comprising 91% of total imports.
Germany, with a CAGR of +13.7%, recorded the highest growth rate of the value of imports, in terms of the main suppliers over the period under review, while purchases for the other leaders experienced mixed trend patterns.
Imports by Type
In 2023, acoustic new upright pianos (91K units) was the main type of pianos and other keyboard stringed musical instruments supplied to China, accounting for a 91% share of total imports. Moreover, acoustic new upright pianos exceeded the figures recorded for the second-largest type, acoustic grand pianos (8.3K units), more than tenfold.
From 2013 to 2023, the average annual rate of growth in terms of the volume of acoustic new upright pianos imports totaled -2.4%. With regard to the other supplied products, the following average annual rates of growth were recorded: acoustic grand pianos (+6.0% per year) and keyboard stringed instruments (+11.0% per year).
In value terms, pianos and other keyboard stringed musical instruments with the largest imports in China were acoustic grand pianos ($102M), acoustic new upright pianos ($95M) and keyboard stringed instruments ($522K).
Import Prices by Country
In 2023, the piano price stood at $1,975 per unit (CIF, China), increasing by 26% against the previous year. Overall, the import price continues to indicate a resilient expansion. The pace of growth appeared the most rapid in 2015 an increase of 99% against the previous year. Over the period under review, average import prices attained the peak figure at $2,984 per unit in 2016; however, from 2017 to 2023, import prices remained at a lower figure.
Prices varied noticeably by country of origin: amid the top importers, the country with the highest price was Indonesia ($2,989 per unit), while the price for South Korea ($228 per unit) was amongst the lowest.
From 2013 to 2023, the most notable rate of growth in terms of prices was attained by Japan (+5.8%), while the prices for the other major suppliers experienced mixed trend patterns.
This report provides an in-depth analysis of the piano market in China. Within it, you will discover the latest data on market trends and opportunities by country, consumption, production and price developments, as well as the global trade (imports and exports). The forecast exhibits the market prospects through 2030.
Product coverage:
- Prodcom 32201110 - Acoustic new upright pianos (including automatic pianos)
- Prodcom 32201130 - Acoustic grand pianos (including automatic pianos)
- Prodcom 32201150 - Keyboard stringed instruments (including harpsichords, s pinets and clavichords)
Country coverage:
Data coverage:
- Market volume and value
- Per Capita consumption
- Forecast of the market dynamics in the medium term
- Trade (exports and imports) in China
- Export and import prices
- Market trends, drivers and restraints
- Key market players and their profiles
Reasons to buy this report:
- Take advantage of the latest data
- Find deeper insights into current market developments
- Discover vital success factors affecting the market
This report is designed for manufacturers, distributors, importers, and wholesalers, as well as for investors, consultants and advisors.
In this report, you can find information that helps you to make informed decisions on the following issues:
- How to diversify your business and benefit from new market opportunities
- How to load your idle production capacity
- How to boost your sales on overseas markets
- How to increase your profit margins
- How to make your supply chain more sustainable
- How to reduce your production and supply chain costs
- How to outsource production to other countries
- How to prepare your business for global expansion
While doing this research, we combine the accumulated expertise of our analysts and the capabilities of artificial intelligence. The AI-based platform, developed by our data scientists, constitutes the key working tool for business analysts, empowering them to discover deep insights and ideas from the marketing data.
-
1. INTRODUCTION
Making Data-Driven Decisions to Grow Your Business
- REPORT DESCRIPTION
- RESEARCH METHODOLOGY AND AI PLATFORM
- DATA-DRIVEN DECISIONS FOR YOUR BUSINESS
- GLOSSARY AND SPECIFIC TERMS
-
2. EXECUTIVE SUMMARY
A Quick Overview of Market Performance
- KEY FINDINGS
- MARKET TRENDS This Chapter is Available Only for the Professional Edition PRO
-
3. MARKET OVERVIEW
Understanding the Current State of The Market and Its Prospects
- MARKET SIZE
- MARKET STRUCTURE
- TRADE BALANCE
- PER CAPITA CONSUMPTION
- MARKET FORECAST TO 2030
-
4. MOST PROMISING PRODUCT
Finding New Products to Diversify Your Business
This Chapter is Available Only for the Professional Edition PRO- TOP PRODUCTS TO DIVERSIFY YOUR BUSINESS
- BEST-SELLING PRODUCTS
- MOST CONSUMED PRODUCT
- MOST TRADED PRODUCT
- MOST PROFITABLE PRODUCT FOR EXPORT
-
5. MOST PROMISING SUPPLYING COUNTRIES
Choosing the Best Countries to Establish Your Sustainable Supply Chain
This Chapter is Available Only for the Professional Edition PRO- TOP COUNTRIES TO SOURCE YOUR PRODUCT
- TOP PRODUCING COUNTRIES
- TOP EXPORTING COUNTRIES
- LOW-COST EXPORTING COUNTRIES
-
6. MOST PROMISING OVERSEAS MARKETS
Choosing the Best Countries to Boost Your Exports
This Chapter is Available Only for the Professional Edition PRO- TOP OVERSEAS MARKETS FOR EXPORTING YOUR PRODUCT
- TOP CONSUMING MARKETS
- UNSATURATED MARKETS
- TOP IMPORTING MARKETS
- MOST PROFITABLE MARKETS
7. PRODUCTION
The Latest Trends and Insights into The Industry
- PRODUCTION VOLUME AND VALUE
8. IMPORTS
The Largest Import Supplying Countries
- IMPORTS FROM 2012–2023
- IMPORTS BY COUNTRY
- IMPORT PRICES BY COUNTRY
9. EXPORTS
The Largest Destinations for Exports
- EXPORTS FROM 2012–2023
- EXPORTS BY COUNTRY
- EXPORT PRICES BY COUNTRY
-
10. PROFILES OF MAJOR PRODUCERS
The Largest Producers on The Market and Their Profiles
This Chapter is Available Only for the Professional Edition PRO -
LIST OF TABLES
- Key Findings In 2023
- Market Volume, In Physical Terms, 2012–2023
- Market Value, 2012–2023
- Per Capita Consumption In 2012-2023
- Imports, In Physical Terms, By Country, 2012–2023
- Imports, In Value Terms, By Country, 2012–2023
- Import Prices, By Country Of Origin, 2012–2023
- Exports, In Physical Terms, By Country, 2012–2023
- Exports, In Value Terms, By Country, 2012–2023
- Export Prices, By Country Of Destination, 2012–2023
-
LIST OF FIGURES
- Market Volume, In Physical Terms, 2012–2023
- Market Value, 2012–2023
- Market Structure – Domestic Supply vs. Imports, In Physical Terms, 2012-2023
- Market Structure – Domestic Supply vs. Imports, In Value Terms, 2012-2023
- Trade Balance, In Physical Terms, 2012-2023
- Trade Balance, In Value Terms, 2012-2023
- Per Capita Consumption, 2012-2023
- Market Volume Forecast to 2030
- Market Value Forecast to 2030
- Products: Market Size And Growth, By Type
- Products: Average Per Capita Consumption, By Type
- Products: Exports And Growth, By Type
- Products: Export Prices And Growth, By Type
- Production Volume And Growth
- Exports And Growth
- Export Prices And Growth
- Market Size And Growth
- Per Capita Consumption
- Imports And Growth
- Import Prices
- Production, In Physical Terms, 2012–2023
- Production, In Value Terms, 2012–2023
- Imports, In Physical Terms, 2012–2023
- Imports, In Value Terms, 2012–2023
- Imports, In Physical Terms, By Country, 2023
- Imports, In Physical Terms, By Country, 2012–2023
- Imports, In Value Terms, By Country, 2012–2023
- Import Prices, By Country Of Origin, 2012–2023
- Exports, In Physical Terms, 2012–2023
- Exports, In Value Terms, 2012–2023
- Exports, In Physical Terms, By Country, 2023
- Exports, In Physical Terms, By Country, 2012–2023
- Exports, In Value Terms, By Country, 2012–2023
- Export Prices, By Country Of Destination, 2012–2023


