India - Stranded Wire, Ropes And Cables - Market Analysis, Forecast, Size, Trends and Insights
Get instant access to more than 2 million reports, dashboards, and datasets on the IndexBox Platform.
View PricingIndia Sets New Record for Exporting Wires, Reaching $917M in 2023
India Stranded Wire Exports
Stranded wire exports from India surged to 282K tons in 2023, growing by 22% on the previous year's figure. Overall, total exports indicated a prominent expansion from 2013 to 2023: its volume increased at an average annual rate of +5.8% over the last decade. The trend pattern, however, indicated some noticeable fluctuations being recorded throughout the analyzed period. Based on 2023 figures, exports increased by +77.4% against 2020 indices. The pace of growth was the most pronounced in 2022 with an increase of 26%. The exports peaked in 2023 and are likely to continue growth in the near future.
In value terms, stranded wire exports surged to $917M (IndexBox estimates) in 2023. Over the period under review, exports enjoyed prominent growth. The pace of growth appeared the most rapid in 2022 when exports increased by 56% against the previous year. The exports peaked in 2023 and are likely to continue growth in the immediate term.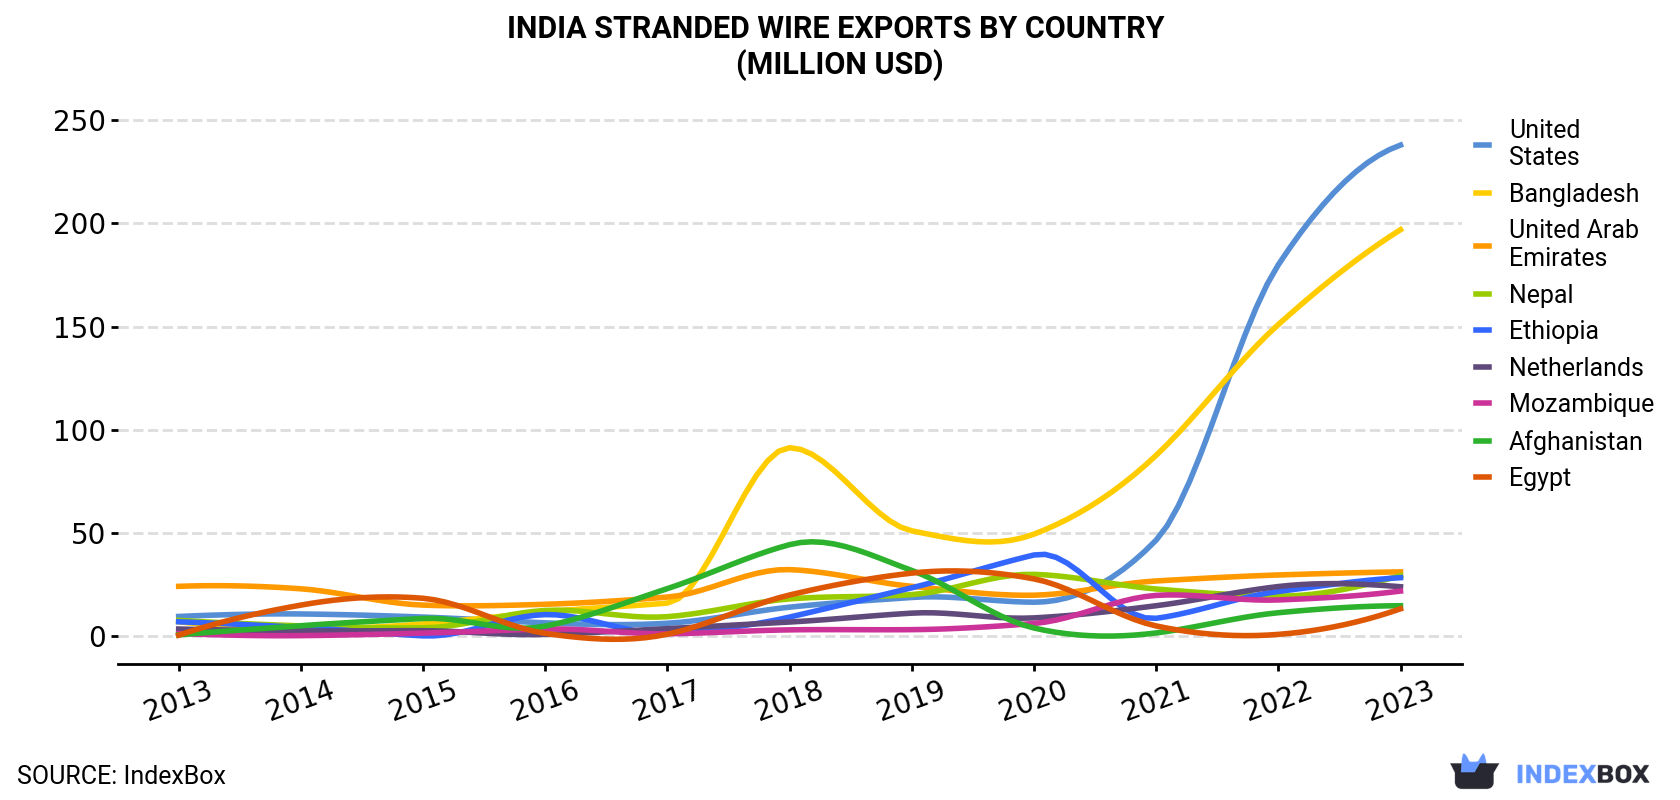
| COUNTRY | Export Value of Stranded Wire in India (million USD) | ||||||||||
|---|---|---|---|---|---|---|---|---|---|---|---|
| 2013 | 2014 | 2015 | 2016 | 2017 | 2018 | 2019 | 2020 | 2021 | 2022 | 2023 | |
| United States | 9.5 | 10.7 | 9.2 | 6.4 | 6.2 | 14.0 | 18.7 | 16.4 | 46.5 | 180 | 238 |
| Bangladesh | 6.9 | 3.5 | 5.9 | 11.7 | 16.0 | 91.3 | 51.0 | 49.4 | 87.6 | 151 | 197 |
| United Arab Emirates | 24.1 | 22.9 | 15.0 | 15.4 | 18.9 | 32.2 | 24.1 | 19.8 | 26.7 | 29.6 | 31.1 |
| Nepal | 7.6 | 4.9 | 4.0 | 12.4 | 9.4 | 18.0 | 20.1 | 29.9 | 22.8 | 19.4 | 29.3 |
| Ethiopia | 6.9 | 4.2 | 0.1 | 10.4 | 1.5 | 9.2 | 23.4 | 39.3 | 8.6 | 21.6 | 28.3 |
| Netherlands | 3.4 | 2.5 | 2.6 | 0.8 | 3.6 | 6.8 | 11.1 | 8.8 | 14.7 | 24.0 | 23.9 |
| Mozambique | 1.2 | 0.2 | 1.4 | 3.4 | 1.1 | 3.0 | 3.1 | 6.1 | 19.7 | 17.5 | 21.8 |
| Afghanistan | 0.6 | 5.0 | 8.5 | 4.8 | 23.0 | 44.3 | 31.8 | 3.9 | 1.5 | 11.3 | 14.7 |
| Egypt | 0.4 | 15.0 | 18.3 | 1.3 | 0.9 | 19.9 | 30.5 | 27.7 | 4.9 | 0.8 | 13.2 |
| Others | 283 | 342 | 266 | 247 | 224 | 179 | 258 | 187 | 225 | 262 | 320 |
| Total | 344 | 411 | 331 | 314 | 304 | 417 | 472 | 388 | 458 | 717 | 917 |
Exports by Country
the United States (64K tons) was the main destination for stranded wire exports from India, accounting for a 23% share of total exports. Moreover, stranded wire exports to the United States exceeded the volume sent to the second major destination, Bangladesh (29K tons), twofold. the United Arab Emirates (16K tons) ranked third in terms of total exports with a 5.7% share.
From 2013 to 2023, the average annual growth rate of volume to the United States totaled +28.3%. Exports to the other major destinations recorded the following average annual rates of exports growth: Bangladesh (+21.7% per year) and the United Arab Emirates (-0.9% per year).
In value terms, the largest markets for stranded wire exported from India were the United States ($238M), Bangladesh ($197M) and the United Arab Emirates ($31M), together comprising 51% of total exports. Nepal, Ethiopia, the Netherlands, Mozambique, Afghanistan and Egypt lagged somewhat behind, together accounting for a further 14%.
In terms of the main countries of destination, Egypt, with a CAGR of +41.7%, saw the highest growth rate of the value of exports, over the period under review, while shipments for the other leaders experienced more modest paces of growth.
Exports by Type
Aluminium; stranded wire, cables, plaited bands and the like, (not electrically insulated) (185K tons), stranded wire, ropes, cables, plaited bands, slings and the like, of iron or steel, not electrically insulated (94K tons) and copper stranded wire, cables and plaited bands (3K tons) were the main products of stranded wire exports from India.
From 2013 to 2023, the most notable rate of growth in terms of shipments, amongst the major product types, was attained by copper stranded wire, cables and plaited bands (with a CAGR of +14.7%), while the other products experienced more modest paces of growth.
In value terms, aluminium; stranded wire, cables, plaited bands and the like, (not electrically insulated) ($695M) remains the largest type of stranded wire, ropes and cables exported from India, comprising 76% of total exports. The second position in the ranking was taken by stranded wire, ropes, cables, plaited bands, slings and the like, of iron or steel, not electrically insulated ($185M), with a 20% share of total exports.
From 2013 to 2023, the average annual growth rate of the value of aluminium; stranded wire, cables, plaited bands and the like, (not electrically insulated) exports totaled +12.2%. With regard to the other exported products, the following average annual rates of growth were recorded: stranded wire, ropes, cables, plaited bands, slings and the like, of iron or steel, not electrically insulated (+5.1% per year) and copper stranded wire, cables and plaited bands (+13.9% per year).
Export Prices by Country
In 2023, the stranded wire price stood at $3,251 per ton (FOB, India), increasing by 4.8% against the previous year. In general, export price indicated a tangible increase from 2013 to 2023: its price increased at an average annual rate of +4.2% over the last decade. The trend pattern, however, indicated some noticeable fluctuations being recorded throughout the analyzed period. Based on 2023 figures, stranded wire export price increased by +33.3% against 2020 indices. The most prominent rate of growth was recorded in 2022 an increase of 24% against the previous year. Over the period under review, the average export prices attained the maximum in 2023 and is expected to retain growth in the near future.
There were significant differences in the average prices for the major overseas markets. In 2023, amid the top suppliers, the country with the highest price was Bangladesh ($6,753 per ton), while the average price for exports to the United Arab Emirates ($1,943 per ton) was amongst the lowest.
From 2013 to 2023, the most notable rate of growth in terms of prices was recorded for supplies to Bangladesh (+14.9%), while the prices for the other major destinations experienced more modest paces of growth.
This report provides an in-depth analysis of the stranded wire market in India. Within it, you will discover the latest data on market trends and opportunities by country, consumption, production and price developments, as well as the global trade (imports and exports). The forecast exhibits the market prospects through 2030.
Product coverage:
- Prodcom 25931130 - Iron or steel stranded wire, ropes and cables (including stranded wires and wire ropes with or without attached fittings not electrically insulated) (excluding electrically insulated)
- Prodcom 25931150 - Iron or steel plaited bands, slings and the like (excluding electrically insulated)
- Prodcom 25931250 - Copper stranded wire, cables, plaited bands and the like excluding electrically insulated, barbed wire and loosely twisted non-barbed double fencing wire, insulated electric wire and cables
- Prodcom 25931270 - Aluminium stranded wire, cables, plaited bands and the like excluding electrically insulated, barbed wire and loosely twisted non-barbed double fencing wire, insulated electric wire and cables
Country coverage:
- India
Data coverage:
- Market volume and value
- Per Capita consumption
- Forecast of the market dynamics in the medium term
- Trade (exports and imports) in India
- Export and import prices
- Market trends, drivers and restraints
- Key market players and their profiles
Reasons to buy this report:
- Take advantage of the latest data
- Find deeper insights into current market developments
- Discover vital success factors affecting the market
This report is designed for manufacturers, distributors, importers, and wholesalers, as well as for investors, consultants and advisors.
In this report, you can find information that helps you to make informed decisions on the following issues:
- How to diversify your business and benefit from new market opportunities
- How to load your idle production capacity
- How to boost your sales on overseas markets
- How to increase your profit margins
- How to make your supply chain more sustainable
- How to reduce your production and supply chain costs
- How to outsource production to other countries
- How to prepare your business for global expansion
While doing this research, we combine the accumulated expertise of our analysts and the capabilities of artificial intelligence. The AI-based platform, developed by our data scientists, constitutes the key working tool for business analysts, empowering them to discover deep insights and ideas from the marketing data.
-
1. INTRODUCTION
Making Data-Driven Decisions to Grow Your Business
- REPORT DESCRIPTION
- RESEARCH METHODOLOGY AND AI PLATFORM
- DATA-DRIVEN DECISIONS FOR YOUR BUSINESS
- GLOSSARY AND SPECIFIC TERMS
-
2. EXECUTIVE SUMMARY
A Quick Overview of Market Performance
- KEY FINDINGS
- MARKET TRENDS This Chapter is Available Only for the Professional Edition PRO
-
3. MARKET OVERVIEW
Understanding the Current State of The Market and Its Prospects
- MARKET SIZE
- MARKET STRUCTURE
- TRADE BALANCE
- PER CAPITA CONSUMPTION
- MARKET FORECAST TO 2030
-
4. MOST PROMISING PRODUCT
Finding New Products to Diversify Your Business
This Chapter is Available Only for the Professional Edition PRO- TOP PRODUCTS TO DIVERSIFY YOUR BUSINESS
- BEST-SELLING PRODUCTS
- MOST CONSUMED PRODUCT
- MOST TRADED PRODUCT
- MOST PROFITABLE PRODUCT FOR EXPORT
-
5. MOST PROMISING SUPPLYING COUNTRIES
Choosing the Best Countries to Establish Your Sustainable Supply Chain
This Chapter is Available Only for the Professional Edition PRO- TOP COUNTRIES TO SOURCE YOUR PRODUCT
- TOP PRODUCING COUNTRIES
- TOP EXPORTING COUNTRIES
- LOW-COST EXPORTING COUNTRIES
-
6. MOST PROMISING OVERSEAS MARKETS
Choosing the Best Countries to Boost Your Exports
This Chapter is Available Only for the Professional Edition PRO- TOP OVERSEAS MARKETS FOR EXPORTING YOUR PRODUCT
- TOP CONSUMING MARKETS
- UNSATURATED MARKETS
- TOP IMPORTING MARKETS
- MOST PROFITABLE MARKETS
7. PRODUCTION
The Latest Trends and Insights into The Industry
- PRODUCTION VOLUME AND VALUE
8. IMPORTS
The Largest Import Supplying Countries
- IMPORTS FROM 2012–2023
- IMPORTS BY COUNTRY
- IMPORT PRICES BY COUNTRY
9. EXPORTS
The Largest Destinations for Exports
- EXPORTS FROM 2012–2023
- EXPORTS BY COUNTRY
- EXPORT PRICES BY COUNTRY
-
10. PROFILES OF MAJOR PRODUCERS
The Largest Producers on The Market and Their Profiles
This Chapter is Available Only for the Professional Edition PRO -
LIST OF TABLES
- Key Findings In 2023
- Market Volume, In Physical Terms, 2012–2023
- Market Value, 2012–2023
- Per Capita Consumption In 2012-2023
- Imports, In Physical Terms, By Country, 2012–2023
- Imports, In Value Terms, By Country, 2012–2023
- Import Prices, By Country Of Origin, 2012–2023
- Exports, In Physical Terms, By Country, 2012–2023
- Exports, In Value Terms, By Country, 2012–2023
- Export Prices, By Country Of Destination, 2012–2023
-
LIST OF FIGURES
- Market Volume, In Physical Terms, 2012–2023
- Market Value, 2012–2023
- Market Structure – Domestic Supply vs. Imports, In Physical Terms, 2012-2023
- Market Structure – Domestic Supply vs. Imports, In Value Terms, 2012-2023
- Trade Balance, In Physical Terms, 2012-2023
- Trade Balance, In Value Terms, 2012-2023
- Per Capita Consumption, 2012-2023
- Market Volume Forecast to 2030
- Market Value Forecast to 2030
- Products: Market Size And Growth, By Type
- Products: Average Per Capita Consumption, By Type
- Products: Exports And Growth, By Type
- Products: Export Prices And Growth, By Type
- Production Volume And Growth
- Exports And Growth
- Export Prices And Growth
- Market Size And Growth
- Per Capita Consumption
- Imports And Growth
- Import Prices
- Production, In Physical Terms, 2012–2023
- Production, In Value Terms, 2012–2023
- Imports, In Physical Terms, 2012–2023
- Imports, In Value Terms, 2012–2023
- Imports, In Physical Terms, By Country, 2023
- Imports, In Physical Terms, By Country, 2012–2023
- Imports, In Value Terms, By Country, 2012–2023
- Import Prices, By Country Of Origin, 2012–2023
- Exports, In Physical Terms, 2012–2023
- Exports, In Value Terms, 2012–2023
- Exports, In Physical Terms, By Country, 2023
- Exports, In Physical Terms, By Country, 2012–2023
- Exports, In Value Terms, By Country, 2012–2023
- Export Prices, By Country Of Destination, 2012–2023


