South Africa - Iron Ores And Concentrates - Market Analysis, Forecast, Size, Trends And Insights
Get instant access to more than 2 million reports, dashboards, and datasets on the IndexBox Platform.
View PricingIron Ore Export in South Africa Increases Slightly to $6.5B in 2023
South Africa Iron Ore Exports
In 2023, the amount of iron ores and concentrates exported from South Africa soared to 60M tons, increasing by 32% against the previous year's figure. Overall, exports, however, continue to indicate a relatively flat trend pattern. The most prominent rate of growth was recorded in 2017 when exports increased by 37%. The exports peaked at 69M tons in 2014; however, from 2015 to 2023, the exports remained at a lower figure.
In value terms, iron ore exports stood at $6.5B (IndexBox estimates) in 2023. In general, exports, however, saw a pronounced curtailment. The most prominent rate of growth was recorded in 2021 with an increase of 66%. As a result, the exports reached the peak of $10.2B. From 2022 to 2023, the growth of the exports failed to regain momentum.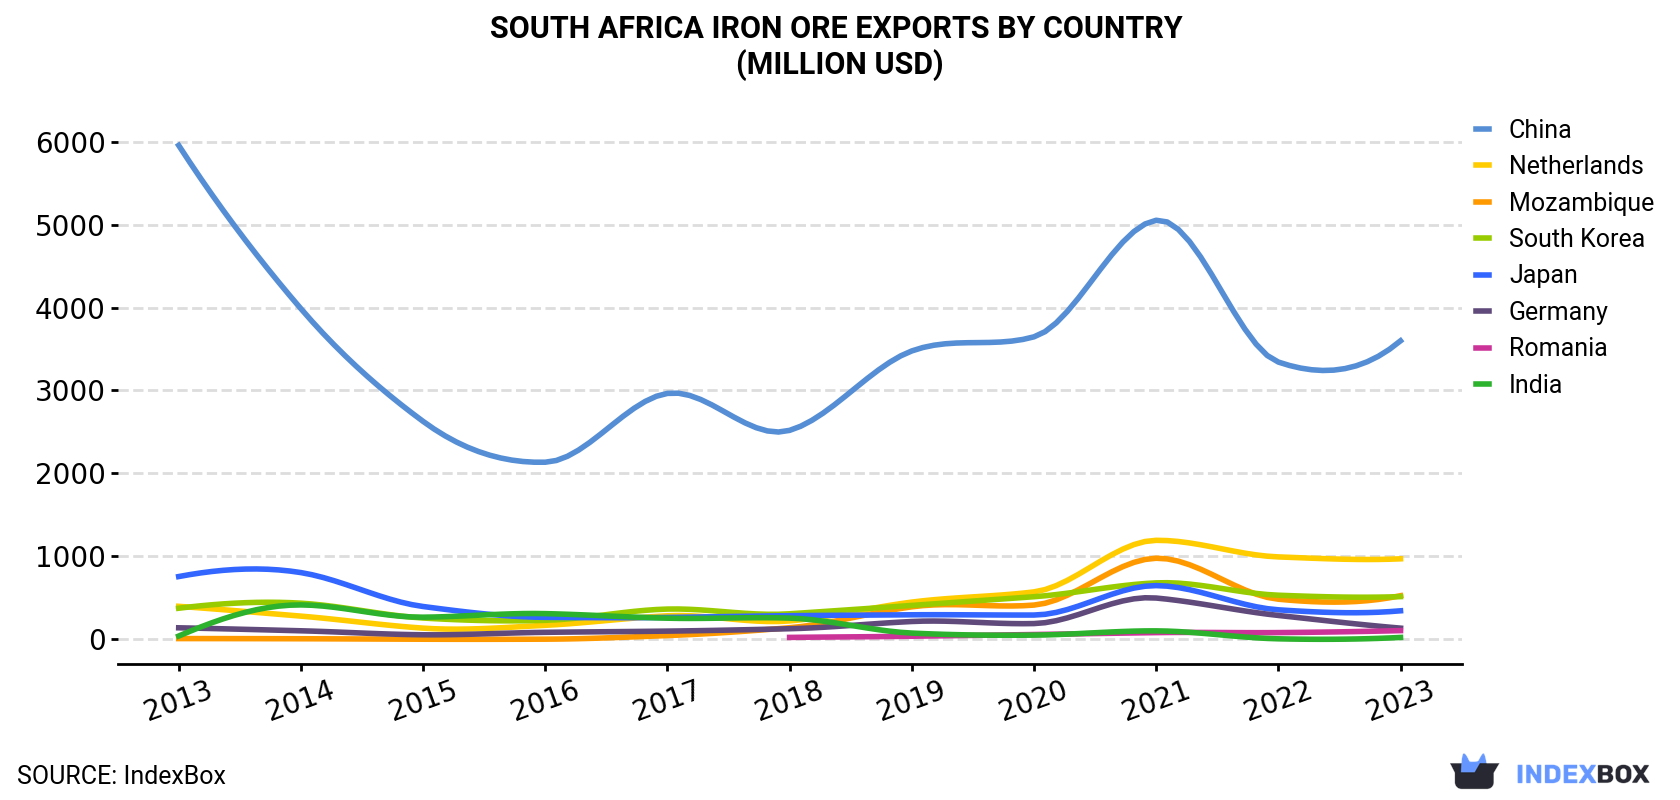
| COUNTRY | Export Value of Iron Ore in South Africa (million USD) | ||||||||||
|---|---|---|---|---|---|---|---|---|---|---|---|
| 2013 | 2014 | 2015 | 2016 | 2017 | 2018 | 2019 | 2020 | 2021 | 2022 | 2023 | |
| China | 5,956 | 3,987 | 2,628 | 2,135 | 2,965 | 2,519 | 3,477 | 3,647 | 5,053 | 3,343 | 3,599 |
| Netherlands | 397 | 279 | 134 | 168 | 283 | 221 | 448 | 571 | 1,193 | 993 | 970 |
| Mozambique | 8.0 | 5.9 | 0.3 | 1.0 | 44.4 | 139 | 391 | 412 | 977 | 483 | 525 |
| South Korea | 374 | 435 | 256 | 228 | 364 | 307 | 408 | 513 | 680 | 531 | 514 |
| Japan | 756 | 804 | 395 | 264 | 263 | 284 | 295 | 292 | 647 | 355 | 343 |
| Germany | 138 | 102 | 53.9 | 83.5 | 98.1 | 127 | 214 | 189 | 497 | 287 | 134 |
| Romania | N/A | N/A | N/A | N/A | N/A | 22.2 | 36.4 | 57.1 | 80.0 | 80.3 | 104 |
| India | 38.4 | 414 | 266 | 309 | 254 | 255 | 74.4 | 49.8 | 101 | 5.3 | 21.6 |
| Others | 787 | 847 | 389 | 398 | 526 | 409 | 432 | 382 | 935 | 412 | 314 |
| Total | 8,455 | 6,874 | 4,121 | 3,586 | 4,798 | 4,282 | 5,777 | 6,112 | 10,163 | 6,489 | 6,524 |
Exports by Country
China (33M tons) was the main destination for iron ore exports from South Africa, accounting for a 55% share of total exports. Moreover, iron ore exports to China exceeded the volume sent to the second major destination, the Netherlands (8.7M tons), fourfold. Mozambique (5.2M tons) ranked third in terms of total exports with an 8.8% share.
From 2013 to 2023, the average annual growth rate of volume to China stood at -3.0%. Exports to the other major destinations recorded the following average annual rates of exports growth: the Netherlands (+10.2% per year) and Mozambique (+42.5% per year).
In value terms, China ($3.6B) remains the key foreign market for iron ores and concentrates exports from South Africa, comprising 55% of total exports. The second position in the ranking was taken by the Netherlands ($970M), with a 15% share of total exports. It was followed by Mozambique, with an 8% share.
From 2013 to 2023, the average annual rate of growth in terms of value to China stood at -4.9%. Exports to the other major destinations recorded the following average annual rates of exports growth: the Netherlands (+9.3% per year) and Mozambique (+51.9% per year).
Export Prices by Country
In 2023, the iron ore price amounted to $110 per ton (FOB, South Africa), falling by -23.6% against the previous year. Overall, the export price saw a slight contraction. The most prominent rate of growth was recorded in 2021 an increase of 60% against the previous year. As a result, the export price attained the peak level of $150 per ton. From 2022 to 2023, the average export prices remained at a lower figure.
Average prices varied noticeably for the major overseas markets. In 2023, amid the top suppliers, the countries with the highest prices were India ($121 per ton) and Japan ($117 per ton), while the average price for exports to Mozambique ($100 per ton) and China ($109 per ton) were amongst the lowest.
From 2013 to 2023, the most notable rate of growth in terms of prices was recorded for supplies to Romania (+11.0%), while the prices for the other major destinations experienced more modest paces of growth.
This report provides an in-depth analysis of the iron ore market in South Africa. Within it, you will discover the latest data on market trends and opportunities by country, consumption, production and price developments, as well as the global trade (imports and exports). The forecast exhibits the market prospects through 2030.
Product coverage:
- Prodcom 07101000 - Iron ores and concentrates (excluding roasted iron pyrites)
- Prodcom 07101010 -
- Prodcom 07101020 -
Country coverage:
- South Africa
Data coverage:
- Market volume and value
- Per Capita consumption
- Forecast of the market dynamics in the medium term
- Trade (exports and imports) in South Africa
- Export and import prices
- Market trends, drivers and restraints
- Key market players and their profiles
Reasons to buy this report:
- Take advantage of the latest data
- Find deeper insights into current market developments
- Discover vital success factors affecting the market
This report is designed for manufacturers, distributors, importers, and wholesalers, as well as for investors, consultants and advisors.
In this report, you can find information that helps you to make informed decisions on the following issues:
- How to diversify your business and benefit from new market opportunities
- How to load your idle production capacity
- How to boost your sales on overseas markets
- How to increase your profit margins
- How to make your supply chain more sustainable
- How to reduce your production and supply chain costs
- How to outsource production to other countries
- How to prepare your business for global expansion
While doing this research, we combine the accumulated expertise of our analysts and the capabilities of artificial intelligence. The AI-based platform, developed by our data scientists, constitutes the key working tool for business analysts, empowering them to discover deep insights and ideas from the marketing data.
-
1. INTRODUCTION
Making Data-Driven Decisions to Grow Your Business
- REPORT DESCRIPTION
- RESEARCH METHODOLOGY AND AI PLATFORM
- DATA-DRIVEN DECISIONS FOR YOUR BUSINESS
- GLOSSARY AND SPECIFIC TERMS
-
2. EXECUTIVE SUMMARY
A Quick Overview of Market Performance
- KEY FINDINGS
- MARKET TRENDS This Chapter is Available Only for the Professional Edition PRO
-
3. MARKET OVERVIEW
Understanding the Current State of The Market and Its Prospects
- MARKET SIZE
- MARKET STRUCTURE
- TRADE BALANCE
- PER CAPITA CONSUMPTION
- MARKET FORECAST TO 2030
-
4. MOST PROMISING PRODUCT
Finding New Products to Diversify Your Business
This Chapter is Available Only for the Professional Edition PRO- TOP PRODUCTS TO DIVERSIFY YOUR BUSINESS
- BEST-SELLING PRODUCTS
- MOST CONSUMED PRODUCT
- MOST TRADED PRODUCT
- MOST PROFITABLE PRODUCT FOR EXPORT
-
5. MOST PROMISING SUPPLYING COUNTRIES
Choosing the Best Countries to Establish Your Sustainable Supply Chain
This Chapter is Available Only for the Professional Edition PRO- TOP COUNTRIES TO SOURCE YOUR PRODUCT
- TOP PRODUCING COUNTRIES
- TOP EXPORTING COUNTRIES
- LOW-COST EXPORTING COUNTRIES
-
6. MOST PROMISING OVERSEAS MARKETS
Choosing the Best Countries to Boost Your Exports
This Chapter is Available Only for the Professional Edition PRO- TOP OVERSEAS MARKETS FOR EXPORTING YOUR PRODUCT
- TOP CONSUMING MARKETS
- UNSATURATED MARKETS
- TOP IMPORTING MARKETS
- MOST PROFITABLE MARKETS
7. PRODUCTION
The Latest Trends and Insights into The Industry
- PRODUCTION VOLUME AND VALUE
8. IMPORTS
The Largest Import Supplying Countries
- IMPORTS FROM 2012–2023
- IMPORTS BY COUNTRY
- IMPORT PRICES BY COUNTRY
9. EXPORTS
The Largest Destinations for Exports
- EXPORTS FROM 2012–2023
- EXPORTS BY COUNTRY
- EXPORT PRICES BY COUNTRY
-
10. PROFILES OF MAJOR PRODUCERS
The Largest Producers on The Market and Their Profiles
This Chapter is Available Only for the Professional Edition PRO -
LIST OF TABLES
- Key Findings In 2023
- Market Volume, In Physical Terms, 2012–2023
- Market Value, 2012–2023
- Per Capita Consumption In 2012-2023
- Imports, In Physical Terms, By Country, 2012–2023
- Imports, In Value Terms, By Country, 2012–2023
- Import Prices, By Country Of Origin, 2012–2023
- Exports, In Physical Terms, By Country, 2012–2023
- Exports, In Value Terms, By Country, 2012–2023
- Export Prices, By Country Of Destination, 2012–2023
-
LIST OF FIGURES
- Market Volume, In Physical Terms, 2012–2023
- Market Value, 2012–2023
- Market Structure – Domestic Supply vs. Imports, In Physical Terms, 2012-2023
- Market Structure – Domestic Supply vs. Imports, In Value Terms, 2012-2023
- Trade Balance, In Physical Terms, 2012-2023
- Trade Balance, In Value Terms, 2012-2023
- Per Capita Consumption, 2012-2023
- Market Volume Forecast to 2030
- Market Value Forecast to 2030
- Products: Market Size And Growth, By Type
- Products: Average Per Capita Consumption, By Type
- Products: Exports And Growth, By Type
- Products: Export Prices And Growth, By Type
- Production Volume And Growth
- Exports And Growth
- Export Prices And Growth
- Market Size And Growth
- Per Capita Consumption
- Imports And Growth
- Import Prices
- Production, In Physical Terms, 2012–2023
- Production, In Value Terms, 2012–2023
- Imports, In Physical Terms, 2012–2023
- Imports, In Value Terms, 2012–2023
- Imports, In Physical Terms, By Country, 2023
- Imports, In Physical Terms, By Country, 2012–2023
- Imports, In Value Terms, By Country, 2012–2023
- Import Prices, By Country Of Origin, 2012–2023
- Exports, In Physical Terms, 2012–2023
- Exports, In Value Terms, 2012–2023
- Exports, In Physical Terms, By Country, 2023
- Exports, In Physical Terms, By Country, 2012–2023
- Exports, In Value Terms, By Country, 2012–2023
- Export Prices, By Country Of Destination, 2012–2023


