World - Palm Oil - Market Analysis, Forecast, Size, Trends and Insights
Get instant access to more than 2 million reports, dashboards, and datasets on the IndexBox Platform.
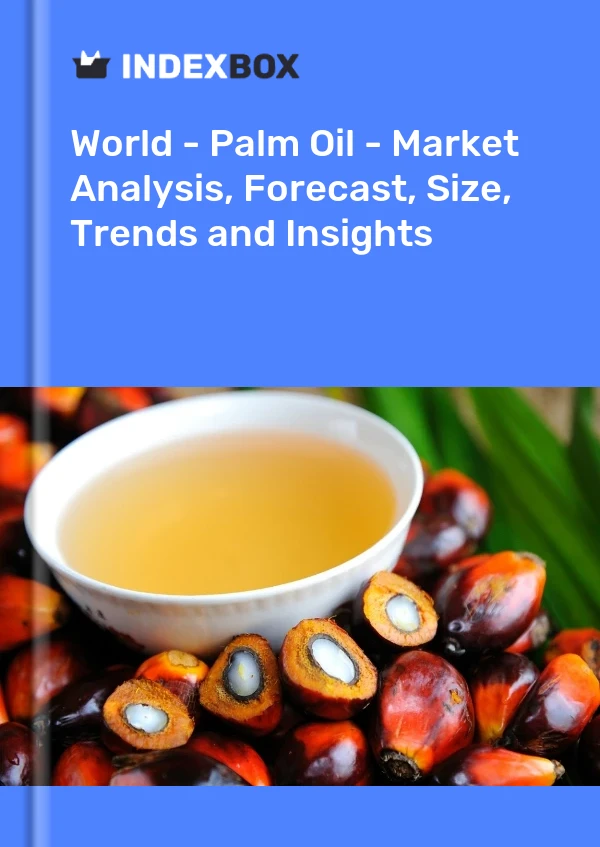
View PricingPalm Oil Market
The global palm oil market is forecasted to grow with a CAGR of +4.0% in volume and +6.3% in value from 2022 to 2030, reaching 108M tons and $119.1B respectively. Indonesia dominates both production and consumption. Refined palm oil is the leading product type in exports with a CAGR of +3.3%. Prices have shown consistent growth with notable fluctuations over the years. Import prices have a moderately higher trend compared to export prices. Overall, the palm oil market is expected to see steady growth in the near future.
Market Forecast
Driven by increasing demand for palm oil worldwide, the market is expected to continue an upward consumption trend over the next eight-year period. Market performance is forecast to retain its current trend pattern, expanding with an anticipated CAGR of +4.0% for the period from 2022 to 2030, which is projected to bring the market volume to 108M tons by the end of 2030.
In value terms, the market is forecast to increase with an anticipated CAGR of +6.3% for the period from 2022 to 2030, which is projected to bring the market value to $119.1B (in nominal prices) by the end of 2030.
Consumption
World Consumption of Palm Oil
In 2022, global palm oil consumption fell modestly to 79M tons, which is down by -4.1% compared with the year before. The total consumption volume increased at an average annual rate of +3.6% over the period from 2012 to 2022; however, the trend pattern indicated some noticeable fluctuations being recorded in certain years. Global consumption peaked at 82M tons in 2019; however, from 2020 to 2022, consumption remained at a lower figure.
The global palm oil market size totaled $73.1B in 2022, rising by 5.4% against the previous year. This figure reflects the total revenues of producers and importers (excluding logistics costs, retail marketing costs, and retailers' margins, which will be included in the final consumer price). Overall, the total consumption indicated measured growth from 2012 to 2022: its value increased at an average annual rate of +3.2% over the last decade. The trend pattern, however, indicated some noticeable fluctuations being recorded throughout the analyzed period. Based on 2022 figures, consumption increased by +65.3% against 2016 indices. Over the period under review, the global market attained the maximum level in 2022 and is expected to retain growth in the immediate term.
Consumption By Country
Indonesia (20M tons) constituted the country with the largest volume of palm oil consumption, comprising approx. 26% of total volume. Moreover, palm oil consumption in Indonesia exceeded the figures recorded by the second-largest consumer, India (9.2M tons), twofold. Malaysia (7M tons) ranked third in terms of total consumption with a 9% share.
From 2012 to 2022, the average annual rate of growth in terms of volume in Indonesia amounted to +11.0%. The remaining consuming countries recorded the following average annual rates of consumption growth: India (+1.8% per year) and Malaysia (+3.7% per year).
In value terms, the largest palm oil markets worldwide were Indonesia ($13.2B), India ($10.1B) and China ($5.4B), with a combined 39% share of the global market. Malaysia, Pakistan, the Netherlands, the United States, Italy, Spain, Thailand, Bangladesh, Nigeria and Colombia lagged somewhat behind, together comprising a further 28%.
Spain, with a CAGR of +9.3%, recorded the highest rates of growth with regard to market size among the main consuming countries over the period under review, while market for the other global leaders experienced more modest paces of growth.
The countries with the highest levels of palm oil per capita consumption in 2022 were Malaysia (212 kg per person), the Netherlands (123 kg per person) and Indonesia (73 kg per person).
From 2012 to 2022, the most notable rate of growth in terms of consumption, amongst the leading consuming countries, was attained by Indonesia (with a CAGR of +9.7%), while consumption for the other global leaders experienced more modest paces of growth.
Production
World Production of Palm Oil
In 2022, global palm oil production contracted modestly to 80M tons, remaining stable against the year before. The total output volume increased at an average annual rate of +3.6% over the period from 2012 to 2022; however, the trend pattern indicated some noticeable fluctuations being recorded in certain years. The pace of growth appeared the most rapid in 2017 when the production volume increased by 18% against the previous year. Global production peaked at 82M tons in 2019; however, from 2020 to 2022, production remained at a lower figure.
In value terms, palm oil production expanded modestly to $52.5B in 2022 estimated in export price. Overall, production continues to indicate a relatively flat trend pattern. The pace of growth appeared the most rapid in 2017 with an increase of 23% against the previous year. Over the period under review, global production hit record highs at $55.1B in 2012; however, from 2013 to 2022, production stood at a somewhat lower figure.
Production By Country
Indonesia (45M tons) constituted the country with the largest volume of palm oil production, comprising approx. 57% of total volume. Moreover, palm oil production in Indonesia exceeded the figures recorded by the second-largest producer, Malaysia (19M tons), twofold. Thailand (2.8M tons) ranked third in terms of total production with a 3.5% share.
In Indonesia, palm oil production expanded at an average annual rate of +5.7% over the period from 2012-2022. In the other countries, the average annual rates were as follows: Malaysia (+0.3% per year) and Thailand (+4.5% per year).
Imports
World Imports of Palm Oil
In 2022, the amount of palm oil imported worldwide shrank to 45M tons, waning by -5.7% against the previous year. The total import volume increased at an average annual rate of +1.6% from 2012 to 2022; the trend pattern remained consistent, with somewhat noticeable fluctuations being observed in certain years. The most prominent rate of growth was recorded in 2017 when imports increased by 12% against the previous year. Global imports peaked at 50M tons in 2019; however, from 2020 to 2022, imports stood at a somewhat lower figure.
In value terms, palm oil imports expanded sharply to $57.1B in 2022. Over the period under review, total imports indicated a moderate increase from 2012 to 2022: its value increased at an average annual rate of +3.5% over the last decade. The trend pattern, however, indicated some noticeable fluctuations being recorded throughout the analyzed period. Based on 2022 figures, imports increased by +86.7% against 2019 indices. The most prominent rate of growth was recorded in 2021 when imports increased by 50% against the previous year. Over the period under review, global imports hit record highs in 2022 and are likely to continue growth in the immediate term.
Imports By Country
In 2022, India (9.2M tons), distantly followed by China (4.9M tons) and Pakistan (2.8M tons) represented the key importers of palm oil, together mixing up 38% of total imports. The following importers - the United States (1.7M tons), the Netherlands (1.6M tons), Bangladesh (1.4M tons), Italy (1.4M tons), Malaysia (1.2M tons), Spain (1.1M tons), Turkey (1M tons), the Philippines (1M tons), Russia (1M tons) and Germany (0.8M tons) - together made up 27% of total imports.
From 2012 to 2022, the most notable rate of growth in terms of purchases, amongst the leading importing countries, was attained by the Philippines (with a CAGR of +41.8%), while imports for the other global leaders experienced more modest paces of growth.
In value terms, India ($11.7B) constitutes the largest market for imported palm oil worldwide, comprising 21% of global imports. The second position in the ranking was held by China ($5.8B), with a 10% share of global imports. It was followed by Pakistan, with a 6.7% share.
In India, palm oil imports increased at an average annual rate of +4.0% over the period from 2012-2022. In the other countries, the average annual rates were as follows: China (-1.1% per year) and Pakistan (+6.0% per year).
Imports By Type
Refined palm oil was the key type of palm oil in the world, with the volume of imports accounting for 32M tons, which was approx. 71% of total imports in 2022. It was distantly followed by crude palm oil (13M tons), committing a 29% share of total imports.
Refined palm oil was also the fastest-growing in terms of imports, with a CAGR of +3.3% from 2012 to 2022. crude palm oil (-1.0%) illustrated a downward trend over the same period. Refined palm oil (+9.4 p.p.) significantly strengthened its position in terms of the global imports, while crude palm oil saw its share reduced by -9.4% from 2012 to 2022, respectively.
In value terms, refined palm oil ($41.9B) constitutes the largest type of palm oil imported worldwide, comprising 72% of global imports. The second position in the ranking was held by crude palm oil ($16.7B), with a 28% share of global imports.
For refined palm oil, imports expanded at an average annual rate of +5.2% over the period from 2012-2022.
Import Prices By Type
The average palm oil import price stood at $1,273 per ton in 2022, picking up by 19% against the previous year. Overall, import price indicated slight growth from 2012 to 2022: its price increased at an average annual rate of +1.8% over the last decade. The trend pattern, however, indicated some noticeable fluctuations being recorded throughout the analyzed period. Based on 2022 figures, palm oil import price increased by +109.7% against 2019 indices. The pace of growth appeared the most rapid in 2021 when the average import price increased by 48% against the previous year. Over the period under review, average import prices hit record highs in 2022 and is expected to retain growth in the immediate term.
Average prices varied noticeably amongst the major imported products. In 2022, the product with the highest price was refined palm oil ($1,291 per ton), while the price for crude palm oil amounted to $1,265 per ton.
From 2012 to 2022, the most notable rate of growth in terms of prices was attained by crude palm oil (+2.0%).
Import Prices By Country
In 2022, the average palm oil import price amounted to $1,273 per ton, growing by 19% against the previous year. Over the period under review, import price indicated slight growth from 2012 to 2022: its price increased at an average annual rate of +1.8% over the last decade. The trend pattern, however, indicated some noticeable fluctuations being recorded throughout the analyzed period. Based on 2022 figures, palm oil import price increased by +109.7% against 2019 indices. The most prominent rate of growth was recorded in 2021 an increase of 48%. Over the period under review, average import prices reached the peak figure in 2022 and is expected to retain growth in the near future.
Prices varied noticeably by country of destination: amid the top importers, the country with the highest price was Germany ($1,458 per ton), while Bangladesh ($848 per ton) was amongst the lowest.
From 2012 to 2022, the most notable rate of growth in terms of prices was attained by Germany (+3.0%), while the other global leaders experienced more modest paces of growth.
Exports
World Exports of Palm Oil
In 2022, shipments abroad of palm oil decreased by -0.2% to 46M tons, falling for the third year in a row after three years of growth. The total export volume increased at an average annual rate of +1.7% from 2012 to 2022; the trend pattern remained relatively stable, with only minor fluctuations in certain years. The pace of growth appeared the most rapid in 2017 when exports increased by 13% against the previous year. Over the period under review, the global exports reached the maximum at 51M tons in 2019; however, from 2020 to 2022, the exports stood at a somewhat lower figure.
In value terms, palm oil exports rose sharply to $54.9B in 2022. Over the period under review, total exports indicated a measured expansion from 2012 to 2022: its value increased at an average annual rate of +3.6% over the last decade. The trend pattern, however, indicated some noticeable fluctuations being recorded throughout the analyzed period. Based on 2022 figures, exports increased by +97.7% against 2019 indices. The most prominent rate of growth was recorded in 2021 when exports increased by 52%. Over the period under review, the global exports attained the peak figure in 2022 and are likely to see steady growth in the near future.
Exports By Country
Indonesia was the key exporting country with an export of around 25M tons, which recorded 54% of total exports. It was distantly followed by Malaysia (13M tons), comprising a 29% share of total exports. The following exporters - Thailand (987K tons), the Netherlands (915K tons), Guatemala (813K tons) and Papua New Guinea (725K tons) - each finished at a 7.4% share of total exports.
From 2012 to 2022, the biggest increases were recorded for Thailand (with a CAGR of +12.9%), while shipments for the other global leaders experienced more modest paces of growth.
In value terms, the largest palm oil supplying countries worldwide were Indonesia ($27.8B), Malaysia ($17B) and the Netherlands ($1.4B), with a combined 84% share of global exports. Thailand, Guatemala and Papua New Guinea lagged somewhat behind, together accounting for a further 5.2%.
Thailand, with a CAGR of +15.4%, recorded the highest rates of growth with regard to the value of exports, among the main exporting countries over the period under review, while shipments for the other global leaders experienced more modest paces of growth.
Exports By Type
Refined palm oil was the main exported product with an export of around 35M tons, which accounted for 75% of total exports. It was distantly followed by crude palm oil (11M tons), generating a 25% share of total exports.
Refined palm oil was also the fastest-growing in terms of exports, with a CAGR of +3.3% from 2012 to 2022. crude palm oil (-2.1%) illustrated a downward trend over the same period. Refined palm oil (+11 p.p.) significantly strengthened its position in terms of the global exports, while crude palm oil saw its share reduced by -11.1% from 2012 to 2022, respectively.
In value terms, refined palm oil ($42B) remains the largest type of palm oil supplied worldwide, comprising 77% of global exports. The second position in the ranking was taken by crude palm oil ($12.7B), with a 23% share of global exports.
From 2012 to 2022, the average annual rate of growth in terms of the value of refined palm oil exports totaled +5.2%.
Export Prices By Type
In 2022, the average palm oil export price amounted to $1,183 per ton, rising by 12% against the previous year. Over the period under review, export price indicated a mild increase from 2012 to 2022: its price increased at an average annual rate of +1.9% over the last decade. The trend pattern, however, indicated some noticeable fluctuations being recorded throughout the analyzed period. Based on 2022 figures, palm oil export price increased by +115.5% against 2019 indices. The most prominent rate of growth was recorded in 2021 an increase of 54% against the previous year. Over the period under review, the average export prices attained the peak figure in 2022 and is expected to retain growth in the near future.
Average prices varied noticeably amongst the major exported products. In 2022, the product with the highest price was refined palm oil ($1,212 per ton), while the average price for exports of crude palm oil totaled $1,104 per ton.
From 2012 to 2022, the most notable rate of growth in terms of prices was attained by refined palm oil (+1.9%).
Export Prices By Country
In 2022, the average palm oil export price amounted to $1,183 per ton, rising by 12% against the previous year. In general, export price indicated modest growth from 2012 to 2022: its price increased at an average annual rate of +1.9% over the last decade. The trend pattern, however, indicated some noticeable fluctuations being recorded throughout the analyzed period. Based on 2022 figures, palm oil export price increased by +115.5% against 2019 indices. The pace of growth was the most pronounced in 2021 when the average export price increased by 54% against the previous year. Over the period under review, the average export prices reached the peak figure in 2022 and is likely to see gradual growth in the near future.
Prices varied noticeably by country of origin: amid the top suppliers, the country with the highest price was the Netherlands ($1,570 per ton), while Papua New Guinea ($885 per ton) was amongst the lowest.
From 2012 to 2022, the most notable rate of growth in terms of prices was attained by the Netherlands (+2.6%), while the other global leaders experienced more modest paces of growth.
This report provides an in-depth analysis of the global palm oil market. Within it, you will discover the latest data on market trends and opportunities by country, consumption, production and price developments, as well as the global trade (imports and exports). The forecast exhibits the market prospects through 2030.
Product coverage:
- FCL 257 - Oil of palm
Country coverage:
Worldwide - the report contains statistical data for 200 countries and includes detailed profiles of the 50 largest consuming countries:
- USA
- China
- Japan
- Germany
- United Kingdom
- France
- Brazil
- Italy
- Russian Federation
- India
- Canada
- Australia
- Republic of Korea
- Spain
- Mexico
- Indonesia
- Netherlands
- Turkey
- Saudi Arabia
- Switzerland
- Sweden
- Nigeria
- Poland
- Belgium
- Argentina
- Norway
- Austria
- Thailand
- United Arab Emirates
- Colombia
- Denmark
- South Africa
- Malaysia
- Israel
- Singapore
- Egypt
- Philippines
- Finland
- Chile
- Ireland
- Pakistan
- Greece
- Portugal
- Kazakhstan
- Algeria
- Czech Republic
- Qatar
- Peru
- Romania
- Vietnam
+ the largest producing countries
Data coverage:
- Global market volume and value
- Per Capita consumption
- Forecast of the market dynamics in the medium term
- Global production, split by region and country
- Global trade (exports and imports)
- Export and import prices
- Market trends, drivers and restraints
- Key market players and their profiles
Company coverage:
Reasons to buy this report:
- Take advantage of the latest data
- Find deeper insights into current market developments
- Discover vital success factors affecting the market
This report is designed for manufacturers, distributors, importers, and wholesalers, as well as for investors, consultants and advisors.
In this report, you can find information that helps you to make informed decisions on the following issues:
- How to diversify your business and benefit from new market opportunities
- How to load your idle production capacity
- How to boost your sales on overseas markets
- How to increase your profit margins
- How to make your supply chain more sustainable
- How to reduce your production and supply chain costs
- How to outsource production to other countries
- How to prepare your business for global expansion
While doing this research, we combine the accumulated expertise of our analysts and the capabilities of artificial intelligence. The AI-based platform, developed by our data scientists, constitutes the key working tool for business analysts, empowering them to discover deep insights and ideas from the marketing data.
-
1. INTRODUCTION
Making Data-Driven Decisions to Grow Your Business
- REPORT DESCRIPTION
- RESEARCH METHODOLOGY AND AI PLATFORM
- DATA-DRIVEN DECISIONS FOR YOUR BUSINESS
- GLOSSARY AND SPECIFIC TERMS
-
2. EXECUTIVE SUMMARY
A Quick Overview of Market Performance
- KEY FINDINGS
- MARKET TRENDS This Chapter is Available Only for the Professional Edition PRO
-
3. MARKET OVERVIEW
Understanding the Current State of The Market and Its Prospects
- MARKET SIZE
- CONSUMPTION BY COUNTRY
- MARKET FORECAST TO 2030
-
4. MOST PROMISING PRODUCT
Finding New Products to Diversify Your Business
This Chapter is Available Only for the Professional Edition PRO- TOP PRODUCTS TO DIVERSIFY YOUR BUSINESS
- BEST-SELLING PRODUCTS
- MOST CONSUMED PRODUCT
- MOST TRADED PRODUCT
- MOST PROFITABLE PRODUCT FOR EXPORT
-
5. MOST PROMISING SUPPLYING COUNTRIES
Choosing the Best Countries to Establish Your Sustainable Supply Chain
This Chapter is Available Only for the Professional Edition PRO- TOP COUNTRIES TO SOURCE YOUR PRODUCT
- TOP PRODUCING COUNTRIES
- TOP EXPORTING COUNTRIES
- LOW-COST EXPORTING COUNTRIES
-
6. MOST PROMISING OVERSEAS MARKETS
Choosing the Best Countries to Boost Your Exports
This Chapter is Available Only for the Professional Edition PRO- TOP OVERSEAS MARKETS FOR EXPORTING YOUR PRODUCT
- TOP CONSUMING MARKETS
- UNSATURATED MARKETS
- TOP IMPORTING MARKETS
- MOST PROFITABLE MARKETS
7. GLOBAL PRODUCTION
The Latest Trends and Insights into The Industry
- PRODUCTION VOLUME AND VALUE
- PRODUCTION BY COUNTRY
8. GLOBAL IMPORTS
The Largest Importers on The Market and How They Succeed
- IMPORTS FROM 2012–2023
- IMPORTS BY COUNTRY
- IMPORT PRICES BY COUNTRY
9. GLOBAL EXPORTS
The Largest Exporters on The Market and How They Succeed
- EXPORTS FROM 2012–2023
- EXPORTS BY COUNTRY
- EXPORT PRICES BY COUNTRY
-
10. PROFILES OF MAJOR PRODUCERS
The Largest Producers on The Market and Their Profiles
This Chapter is Available Only for the Professional Edition PRO -
11. COUNTRY PROFILES
The Largest Markets And Their Profiles
This Chapter is Available Only for the Professional Edition PRO- United States
- China
- Japan
- Germany
- United Kingdom
- France
- Brazil
- Italy
- Russian Federation
- India
- Canada
- Australia
- Republic of Korea
- Spain
- Mexico
- Indonesia
- Netherlands
- Turkey
- Saudi Arabia
- Switzerland
- Sweden
- Nigeria
- Poland
- Belgium
- Argentina
- Norway
- Austria
- Thailand
- United Arab Emirates
- Colombia
- Denmark
- South Africa
- Malaysia
- Israel
- Singapore
- Egypt
- Philippines
- Finland
- Chile
- Ireland
- Pakistan
- Greece
- Portugal
- Kazakhstan
- Algeria
- Czech Republic
- Qatar
- Peru
- Romania
- Vietnam
-
LIST OF TABLES
- Key Findings In 2023
- Market Volume, In Physical Terms, 2012–2023
- Market Value, 2012–2023
- Per Capita Consumption, By Country, 2018–2023
- Production, In Physical Terms, By Country, 2012–2023
- Imports, In Physical Terms, By Country, 2012–2023
- Imports, In Value Terms, By Country, 2012–2023
- Import Prices, By Country Of Destination, 2012–2023
- Exports, In Physical Terms, By Country, 2012–2023
- Exports, In Value Terms, By Country, 2012–2023
- Export Prices, By Country Of Origin, 2012–2023
-
LIST OF FIGURES
- Market Volume, In Physical Terms, 2012–2023
- Market Value, 2012–2023
- Consumption, By Country, 2023
- Market Volume Forecast to 2030
- Market Value Forecast to 2030
- Products: Market Size And Growth, By Type
- Products: Average Per Capita Consumption, By Type
- Products: Exports And Growth, By Type
- Products: Export Prices And Growth, By Type
- Production Volume And Growth
- Exports And Growth
- Export Prices And Growth
- Market Size And Growth
- Per Capita Consumption
- Imports And Growth
- Import Prices
- Production, In Physical Terms, 2012–2023
- Production, In Value Terms, 2012–2023
- Production, By Country, 2023
- Production, In Physical Terms, By Country, 2012–2023
- Imports, In Physical Terms, 2012–2023
- Imports, In Value Terms, 2012–2023
- Imports, In Physical Terms, By Country, 2023
- Imports, In Physical Terms, By Country, 2012–2023
- Imports, In Value Terms, By Country, 2012–2023
- Import Prices, By Country, 2012–2023
- Exports, In Physical Terms, 2012–2023
- Exports, In Value Terms, 2012–2023
- Exports, In Physical Terms, By Country, 2023
- Exports, In Physical Terms, By Country, 2012–2023
- Exports, In Value Terms, By Country, 2012–2023
- Export Prices, 2012–2023
This report provides an in-depth analysis of the global palm oil market.
Global Palm Fruit Oil Market Report 2019. This report provides an in-depth analysis of the global palm fruit oil market.
This report provides an in-depth analysis of the global crude palm oil market.
This report provides an in-depth analysis of the global refined palm oil market.
This report provides an in-depth analysis of the global transmission shaft market.
This report provides an in-depth analysis of the global linseed oil market.
This report provides an in-depth analysis of the global surgical glove market.
This report provides an in-depth analysis of the global market for caustic soda in the solid form.
This report provides an in-depth analysis of the global market for reaction initiators and accelerators.
This report provides an in-depth analysis of the global hard plastic comb market.
Learn about the top five import markets for palm oil and their respective import values in 2022. India ranks as the largest importer, followed by China, Pakistan, the United States, and the Netherlands. These countries exhibit significant demand for palm oil due to various factors such as population size, dietary preferences, and industrial applications. Understanding the dynamics of these import markets is crucial for palm oil producers, traders, and other stakeholders in the industry. Get comprehensive insights into the global palm oil market with IndexBox's recent market report.
While Indonesia, planning to expand production, fights for the EU's recognition of palm oil as a biofuel, Malaysia is faced with an acute shortage of labor due to the outflow of guest workers after the pandemic.
In 2015, the countries with the highest levels of palm fruit oil production were Indonesia (X thousand tons), Malaysia (X thousand tons), Thailand (X thousand tons), together accounting for X% of total output.
Explore the top import markets for crude palm oil and the key statistics in the global industry. Learn about the leading countries, import values, and trends.
The global palm oil market revenue amounted to $48B in 2017, surging by 10% against the previous year. This figure reflect...
The global palm oil market increased from X tons in 2007 to X tons in 2016, expanding with an annual average growth rate of +X% per year over that period.
Global palm oil consumption amounted to X thousand tons in 2015, coming up by +X% against the previous year level.
Global palm oil exports amounted to X thousand tons in 2015, ascending by +X% against the previous year level.
Global palm oil imports amounted to X thousand tons in 2015, growing by +X% against the previous year level.
The global production of palm oil was estimated at X million tons in 2013, which was X million tons more than in 2012.


