World - Temporarily Preserved Vegetable - Market Analysis, Forecast, Size, Trends and Insights
Get instant access to more than 2 million reports, dashboards, and datasets on the IndexBox Platform.
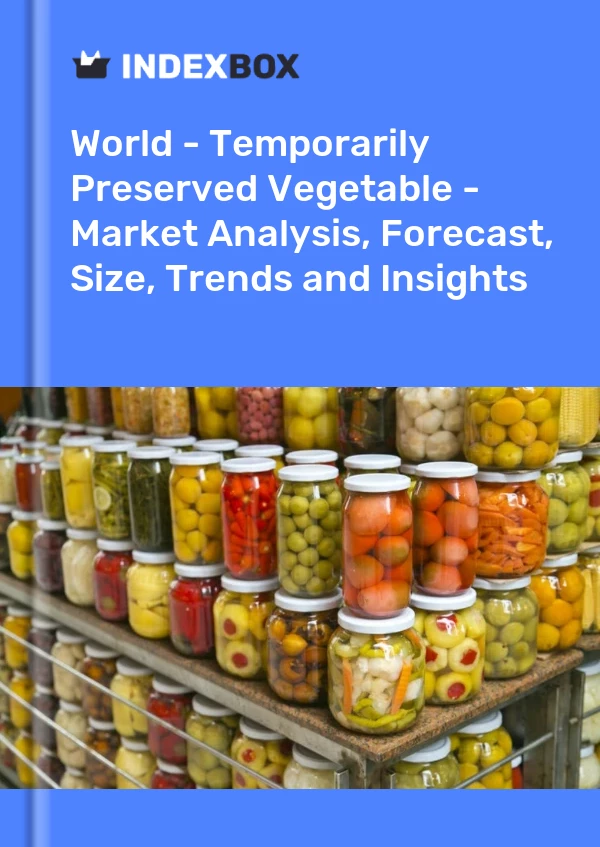
View PricingTemporarily Preserved Vegetable Market
The global market for temporarily preserved vegetables is forecasted to continue its upward consumption trend with an anticipated CAGR of +2.8% from 2022 to 2030. Market performance is expected to expand, reaching a volume of 2.7M tons and a value of $4.2B by the end of 2030. Algeria, China, and India were the top consuming countries in 2022, while Algeria, China, and Taiwan led in market value. The most notable growth in consumption and production was observed in Algeria and Honduras, respectively. Italy, Japan, and South Korea were among the major importers, while China, Spain, and India were the top exporters of temporarily preserved vegetables.
Market Forecast
Driven by increasing demand for vegetables (temporarily preserved) worldwide, the market is expected to continue an upward consumption trend over the next eight-year period. Market performance is forecast to retain its current trend pattern, expanding with an anticipated CAGR of +2.8% for the period from 2022 to 2030, which is projected to bring the market volume to 2.7M tons by the end of 2030.
In value terms, the market is forecast to increase with an anticipated CAGR of +4.9% for the period from 2022 to 2030, which is projected to bring the market value to $4.2B (in nominal prices) by the end of 2030.
Consumption
World Consumption of Temporarily Preserved Vegetable
Global temporarily preserved vegetable consumption stood at 2.2M tons in 2022, almost unchanged from the year before. The total consumption volume increased at an average annual rate of +2.6% over the period from 2012 to 2022; the trend pattern remained relatively stable, with only minor fluctuations being recorded throughout the analyzed period. Over the period under review, global consumption reached the maximum volume at 2.2M tons in 2020; afterwards, it flattened through to 2022.
The global temporarily preserved vegetable market size rose modestly to $2.9B in 2022, increasing by 2.2% against the previous year. This figure reflects the total revenues of producers and importers (excluding logistics costs, retail marketing costs, and retailers' margins, which will be included in the final consumer price). The market value increased at an average annual rate of +2.5% over the period from 2012 to 2022; the trend pattern remained relatively stable, with only minor fluctuations being observed throughout the analyzed period. Global consumption peaked in 2022 and is likely to see steady growth in the immediate term.
Consumption By Country
The countries with the highest volumes of consumption in 2022 were Algeria (482K tons), China (281K tons) and India (192K tons), with a combined 44% share of global consumption.
From 2012 to 2022, the most notable rate of growth in terms of consumption, amongst the key consuming countries, was attained by Algeria (with a CAGR of +8.7%), while consumption for the other global leaders experienced more modest paces of growth.
In value terms, the largest temporarily preserved vegetable markets worldwide were Algeria ($577M), China ($330M) and Taiwan (Chinese) ($216M), together accounting for 39% of the global market.
Algeria, with a CAGR of +5.7%, saw the highest growth rate of market size in terms of the main consuming countries over the period under review, while market for the other global leaders experienced more modest paces of growth.
In 2022, the highest levels of temporarily preserved vegetable per capita consumption was registered in Algeria (11 kg per person), followed by Taiwan (Chinese) (3.1 kg per person), Saudi Arabia (1.5 kg per person) and South Korea (1 kg per person), while the world average per capita consumption of temporarily preserved vegetable was estimated at 0.3 kg per person.
From 2012 to 2022, the average annual growth rate of the temporarily preserved vegetable per capita consumption in Algeria totaled +6.7%. In the other countries, the average annual rates were as follows: Taiwan (Chinese) (+0.9% per year) and Saudi Arabia (+0.1% per year).
Production
World Production of Temporarily Preserved Vegetable
In 2022, global temporarily preserved vegetable production was estimated at 2.1M tons, approximately reflecting the year before. The total output volume increased at an average annual rate of +2.6% over the period from 2012 to 2022; the trend pattern remained relatively stable, with somewhat noticeable fluctuations throughout the analyzed period. The pace of growth was the most pronounced in 2013 when the production volume increased by 4.9% against the previous year. Global production peaked at 2.1M tons in 2020; afterwards, it flattened through to 2022.
In value terms, temporarily preserved vegetable production totaled $2.5B in 2022 estimated in export price. The total output value increased at an average annual rate of +1.8% over the period from 2012 to 2022; the trend pattern remained relatively stable, with somewhat noticeable fluctuations throughout the analyzed period. The pace of growth appeared the most rapid in 2015 when the production volume increased by 24% against the previous year. As a result, production reached the peak level of $3B. From 2016 to 2022, global production growth failed to regain momentum.
Production By Country
The countries with the highest volumes of production in 2022 were Algeria (479K tons), China (411K tons) and India (289K tons), with a combined 55% share of global production. Egypt, Iran, Vietnam, Indonesia, Taiwan (Chinese), Spain, the Philippines, Saudi Arabia and Honduras lagged somewhat behind, together comprising a further 31%.
From 2012 to 2022, the most notable rate of growth in terms of production, amongst the key producing countries, was attained by Honduras (with a CAGR of +11.2%), while production for the other global leaders experienced more modest paces of growth.
Imports
World Imports of Temporarily Preserved Vegetable
In 2022, approx. 573K tons of vegetables (temporarily preserved) were imported worldwide; growing by 3.6% on 2021 figures. Over the period under review, imports saw a relatively flat trend pattern. The pace of growth appeared the most rapid in 2018 when imports increased by 7.6%. As a result, imports attained the peak of 593K tons. From 2019 to 2022, the growth of global imports failed to regain momentum.
In value terms, temporarily preserved vegetable imports rose markedly to $710M in 2022. The total import value increased at an average annual rate of +1.4% from 2012 to 2022; the trend pattern remained relatively stable, with only minor fluctuations throughout the analyzed period. The most prominent rate of growth was recorded in 2013 with an increase of 7.8%. Over the period under review, global imports reached the maximum in 2022 and are expected to retain growth in years to come.
Imports By Country
The purchases of the six major importers of vegetables (temporarily preserved), namely Italy, Japan, South Korea, Spain, the United States and France, represented more than half of total import. The following importers - Russia (23K tons), Belgium (21K tons), Chile (19K tons), Germany (17K tons), Poland (16K tons), Brazil (15K tons) and Turkey (14K tons) - together made up 22% of total imports.
From 2012 to 2022, the biggest increases were recorded for Poland (with a CAGR of +22.4%), while purchases for the other global leaders experienced more modest paces of growth.
In value terms, the largest temporarily preserved vegetable importing markets worldwide were Italy ($124M), Japan ($68M) and France ($62M), with a combined 36% share of global imports. Spain, the United States, Germany, South Korea, Poland, Turkey, Brazil, Belgium, Chile and Russia lagged somewhat behind, together comprising a further 39%.
In terms of the main importing countries, Poland, with a CAGR of +22.3%, recorded the highest growth rate of the value of imports, over the period under review, while purchases for the other global leaders experienced more modest paces of growth.
Import Prices By Country
In 2022, the average temporarily preserved vegetable import price amounted to $1,239 per ton, surging by 2% against the previous year. In general, the import price continues to indicate a relatively flat trend pattern. The growth pace was the most rapid in 2013 an increase of 5.4%. Over the period under review, average import prices reached the maximum at $1,282 per ton in 2014; however, from 2015 to 2022, import prices remained at a lower figure.
There were significant differences in the average prices amongst the major importing countries. In 2022, amid the top importers, the country with the highest price was Italy ($1,986 per ton), while South Korea ($474 per ton) was amongst the lowest.
From 2012 to 2022, the most notable rate of growth in terms of prices was attained by Chile (+4.1%), while the other global leaders experienced more modest paces of growth.
Exports
World Exports of Temporarily Preserved Vegetable
In 2022, overseas shipments of vegetables (temporarily preserved) were finally on the rise to reach 536K tons after three years of decline. Overall, exports showed a relatively flat trend pattern. The most prominent rate of growth was recorded in 2017 when exports increased by 13% against the previous year. Over the period under review, the global exports attained the peak figure at 599K tons in 2014; however, from 2015 to 2022, the exports stood at a somewhat lower figure.
In value terms, temporarily preserved vegetable exports totaled $696M in 2022. The total export value increased at an average annual rate of +1.4% from 2012 to 2022; the trend pattern remained consistent, with only minor fluctuations throughout the analyzed period. The pace of growth appeared the most rapid in 2013 with an increase of 12% against the previous year. The global exports peaked at $701M in 2014; however, from 2015 to 2022, the exports failed to regain momentum.
Exports By Country
The biggest shipments were from China (134K tons), India (99K tons) and Spain (78K tons), together reaching 58% of total export. It was distantly followed by Egypt (42K tons), committing a 7.9% share of total exports. The Netherlands (22K tons), Morocco (21K tons), Peru (16K tons), Syrian Arab Republic (14K tons), Poland (12K tons), Italy (11K tons) and the United States (11K tons) followed a long way behind the leaders.
From 2012 to 2022, the most notable rate of growth in terms of shipments, amongst the leading exporting countries, was attained by Syrian Arab Republic (with a CAGR of +14.9%), while the other global leaders experienced more modest paces of growth.
In value terms, China ($166M), Spain ($93M) and India ($80M) appeared to be the countries with the highest levels of exports in 2022, with a combined 49% share of global exports. Egypt, Morocco, Syrian Arab Republic, Poland, the Netherlands, Italy, Peru and the United States lagged somewhat behind, together accounting for a further 31%.
Syrian Arab Republic, with a CAGR of +13.3%, recorded the highest rates of growth with regard to the value of exports, in terms of the main exporting countries over the period under review, while shipments for the other global leaders experienced more modest paces of growth.
Export Prices By Country
In 2022, the average temporarily preserved vegetable export price amounted to $1,299 per ton, increasing by 3% against the previous year. Over the period from 2012 to 2022, it increased at an average annual rate of +1.0%. The growth pace was the most rapid in 2016 when the average export price increased by 5.1%. Over the period under review, the average export prices hit record highs in 2022 and is likely to see steady growth in years to come.
Prices varied noticeably by country of origin: amid the top suppliers, the country with the highest price was Syrian Arab Republic ($1,971 per ton), while Peru ($793 per ton) was amongst the lowest.
From 2012 to 2022, the most notable rate of growth in terms of prices was attained by Italy (+2.1%), while the other global leaders experienced more modest paces of growth.
This report provides an in-depth analysis of the global temporarily preserved vegetable market. Within it, you will discover the latest data on market trends and opportunities by country, consumption, production and price developments, as well as the global trade (imports and exports). The forecast exhibits the market prospects through 2030.
Product coverage:
- FCL 474 - Vegetables, Temporarily Preserved
Country coverage:
Worldwide - the report contains statistical data for 200 countries and includes detailed profiles of the 50 largest consuming countries:
- USA
- China
- Japan
- Germany
- United Kingdom
- France
- Brazil
- Italy
- Russian Federation
- India
- Canada
- Australia
- Republic of Korea
- Spain
- Mexico
- Indonesia
- Netherlands
- Turkey
- Saudi Arabia
- Switzerland
- Sweden
- Nigeria
- Poland
- Belgium
- Argentina
- Norway
- Austria
- Thailand
- United Arab Emirates
- Colombia
- Denmark
- South Africa
- Malaysia
- Israel
- Singapore
- Egypt
- Philippines
- Finland
- Chile
- Ireland
- Pakistan
- Greece
- Portugal
- Kazakhstan
- Algeria
- Czech Republic
- Qatar
- Peru
- Romania
- Vietnam
+ the largest producing countries
Data coverage:
- Global market volume and value
- Per Capita consumption
- Forecast of the market dynamics in the medium term
- Global production, split by region and country
- Global trade (exports and imports)
- Export and import prices
- Market trends, drivers and restraints
- Key market players and their profiles
Reasons to buy this report:
- Take advantage of the latest data
- Find deeper insights into current market developments
- Discover vital success factors affecting the market
This report is designed for manufacturers, distributors, importers, and wholesalers, as well as for investors, consultants and advisors.
In this report, you can find information that helps you to make informed decisions on the following issues:
- How to diversify your business and benefit from new market opportunities
- How to load your idle production capacity
- How to boost your sales on overseas markets
- How to increase your profit margins
- How to make your supply chain more sustainable
- How to reduce your production and supply chain costs
- How to outsource production to other countries
- How to prepare your business for global expansion
While doing this research, we combine the accumulated expertise of our analysts and the capabilities of artificial intelligence. The AI-based platform, developed by our data scientists, constitutes the key working tool for business analysts, empowering them to discover deep insights and ideas from the marketing data.
-
1. INTRODUCTION
Making Data-Driven Decisions to Grow Your Business
- REPORT DESCRIPTION
- RESEARCH METHODOLOGY AND AI PLATFORM
- DATA-DRIVEN DECISIONS FOR YOUR BUSINESS
- GLOSSARY AND SPECIFIC TERMS
-
2. EXECUTIVE SUMMARY
A Quick Overview of Market Performance
- KEY FINDINGS
- MARKET TRENDS This Chapter is Available Only for the Professional Edition PRO
-
3. MARKET OVERVIEW
Understanding the Current State of The Market and Its Prospects
- MARKET SIZE
- CONSUMPTION BY COUNTRY
- MARKET FORECAST TO 2030
-
4. MOST PROMISING PRODUCT
Finding New Products to Diversify Your Business
This Chapter is Available Only for the Professional Edition PRO- TOP PRODUCTS TO DIVERSIFY YOUR BUSINESS
- BEST-SELLING PRODUCTS
- MOST CONSUMED PRODUCT
- MOST TRADED PRODUCT
- MOST PROFITABLE PRODUCT FOR EXPORT
-
5. MOST PROMISING SUPPLYING COUNTRIES
Choosing the Best Countries to Establish Your Sustainable Supply Chain
This Chapter is Available Only for the Professional Edition PRO- TOP COUNTRIES TO SOURCE YOUR PRODUCT
- TOP PRODUCING COUNTRIES
- TOP EXPORTING COUNTRIES
- LOW-COST EXPORTING COUNTRIES
-
6. MOST PROMISING OVERSEAS MARKETS
Choosing the Best Countries to Boost Your Exports
This Chapter is Available Only for the Professional Edition PRO- TOP OVERSEAS MARKETS FOR EXPORTING YOUR PRODUCT
- TOP CONSUMING MARKETS
- UNSATURATED MARKETS
- TOP IMPORTING MARKETS
- MOST PROFITABLE MARKETS
7. GLOBAL PRODUCTION
The Latest Trends and Insights into The Industry
- PRODUCTION VOLUME AND VALUE
- PRODUCTION BY COUNTRY
8. GLOBAL IMPORTS
The Largest Importers on The Market and How They Succeed
- IMPORTS FROM 2012–2023
- IMPORTS BY COUNTRY
- IMPORT PRICES BY COUNTRY
9. GLOBAL EXPORTS
The Largest Exporters on The Market and How They Succeed
- EXPORTS FROM 2012–2023
- EXPORTS BY COUNTRY
- EXPORT PRICES BY COUNTRY
-
10. PROFILES OF MAJOR PRODUCERS
The Largest Producers on The Market and Their Profiles
This Chapter is Available Only for the Professional Edition PRO -
11. COUNTRY PROFILES
The Largest Markets And Their Profiles
This Chapter is Available Only for the Professional Edition PRO- United States
- China
- Japan
- Germany
- United Kingdom
- France
- Brazil
- Italy
- Russian Federation
- India
- Canada
- Australia
- Republic of Korea
- Spain
- Mexico
- Indonesia
- Netherlands
- Turkey
- Saudi Arabia
- Switzerland
- Sweden
- Nigeria
- Poland
- Belgium
- Argentina
- Norway
- Austria
- Thailand
- United Arab Emirates
- Colombia
- Denmark
- South Africa
- Malaysia
- Israel
- Singapore
- Egypt
- Philippines
- Finland
- Chile
- Ireland
- Pakistan
- Greece
- Portugal
- Kazakhstan
- Algeria
- Czech Republic
- Qatar
- Peru
- Romania
- Vietnam
-
LIST OF TABLES
- Key Findings In 2023
- Market Volume, In Physical Terms, 2012–2023
- Market Value, 2012–2023
- Per Capita Consumption, By Country, 2018–2023
- Production, In Physical Terms, By Country, 2012–2023
- Imports, In Physical Terms, By Country, 2012–2023
- Imports, In Value Terms, By Country, 2012–2023
- Import Prices, By Country Of Destination, 2012–2023
- Exports, In Physical Terms, By Country, 2012–2023
- Exports, In Value Terms, By Country, 2012–2023
- Export Prices, By Country Of Origin, 2012–2023
-
LIST OF FIGURES
- Market Volume, In Physical Terms, 2012–2023
- Market Value, 2012–2023
- Consumption, By Country, 2023
- Market Volume Forecast to 2030
- Market Value Forecast to 2030
- Products: Market Size And Growth, By Type
- Products: Average Per Capita Consumption, By Type
- Products: Exports And Growth, By Type
- Products: Export Prices And Growth, By Type
- Production Volume And Growth
- Exports And Growth
- Export Prices And Growth
- Market Size And Growth
- Per Capita Consumption
- Imports And Growth
- Import Prices
- Production, In Physical Terms, 2012–2023
- Production, In Value Terms, 2012–2023
- Production, By Country, 2023
- Production, In Physical Terms, By Country, 2012–2023
- Imports, In Physical Terms, 2012–2023
- Imports, In Value Terms, 2012–2023
- Imports, In Physical Terms, By Country, 2023
- Imports, In Physical Terms, By Country, 2012–2023
- Imports, In Value Terms, By Country, 2012–2023
- Import Prices, By Country, 2012–2023
- Exports, In Physical Terms, 2012–2023
- Exports, In Value Terms, 2012–2023
- Exports, In Physical Terms, By Country, 2023
- Exports, In Physical Terms, By Country, 2012–2023
- Exports, In Value Terms, By Country, 2012–2023
- Export Prices, 2012–2023
This report provides an in-depth analysis of the global temporarily preserved vegetable market.
Global Temporarily Preserved Vegetable Market Report 2019. This report provides an in-depth analysis of the global temporarily preserved vegetable market.
This report provides an in-depth analysis of the global aluminium foil market.
This report provides an in-depth analysis of the global fresh whole chicken market.
Global Men’S Underpant Market Report 2018. This report provides an in-depth analysis of the global menu2019s underpant market.
This report provides an in-depth analysis of the global chicken egg market.
This report provides an in-depth analysis of the global watermelon market.
This report provides an in-depth analysis of the global monophenols market.
This report provides an in-depth analysis of the global market for safety glass, toughened (tempered), of size and shape suitable for incorporation in vehicles, aircraft, spacecraft or vessels.
This report provides an in-depth analysis of the global market for non-malleable cast iron pipe fittings.
The largest temporarily preserved vegetable importing markets worldwide were Italy ($98M), Japan ($77M) and France ($50M).
China continues to lead the way in the global temporarily preserved vegetable trade. In 2014, China exported X thousand tons of temporarily preserved vegetables totaling X million USD, X% under the previous year. Its primary trading partner was J
Explore the top import markets for aluminium foil and their key statistics. Find out which countries lead the global market and their import values. Discover the latest trends in the aluminium foil industry.
Explore the top import markets for aluminium foil and their key statistics. From the United States to Germany, discover the countries driving the demand for this versatile product.
Explore the top import markets for chicken egg and the key players in the global industry. Learn about the import values of countries like Germany, Netherlands, and Hong Kong SAR.
The global chicken egg market continues to expand and is forecast to reach 138M tons by 2030 thanks to an increase in demand, driven by population growth. During the pandemic, sales to the HoReCa sector crashed, however, this was offset by heightened demand from the retail market. With a 50% global market share, China remains the absolute leader in egg consumption. The diminishing use of preventative antibiotics within livestock emerges as a market trend. This potentially causes the safer form of medication, immunotherapy, to become an attractive sector for investments.
Global watermelon consumption amounted to X thousand tons in 2015, picking up by +X% against the previous year level.
Global watermelon exports amounted to X thousand tons in 2015, rising by +X% against the previous year level.
In 2015, the country with the largest volume of the watermelon output was China (X thousand tons), accounting for X% of global production.
Mexico dominates in the global watermelon trade. In 2014, Mexico exported X thousand tons of watermelon totaling X million USD, X% under the previous year. Its primary trading partner was the U.S., where it supplied X% of its total watermelon ex


