U.S. Canned Fruit And Vegetable Market. Analysis And Forecast to 2030
Get instant access to more than 2 million reports, dashboards, and datasets on the IndexBox Platform.
View PricingImport of Canned Fruits and Vegetables in July 2023 Declines by 4% to $748M in the United States
U.S. Canned Fruit And Vegetable Imports
In July 2023, canned fruit and vegetable imports into the United States declined to 418K tons, which is down by -8.6% against the previous month's figure. Over the period under review, imports, however, showed a relatively flat trend pattern. The pace of growth was the most pronounced in October 2022 with an increase of 42% against the previous month. As a result, imports attained the peak of 566K tons. From November 2022 to July 2023, the growth of imports remained at a lower figure.
In value terms, canned fruit and vegetable imports shrank slightly to $748M (IndexBox estimates) in July 2023. Overall, imports, however, saw a relatively flat trend pattern. The most prominent rate of growth was recorded in October 2022 when imports increased by 19% m-o-m. As a result, imports attained the peak of $850M. From November 2022 to July 2023, the growth of imports failed to regain momentum. 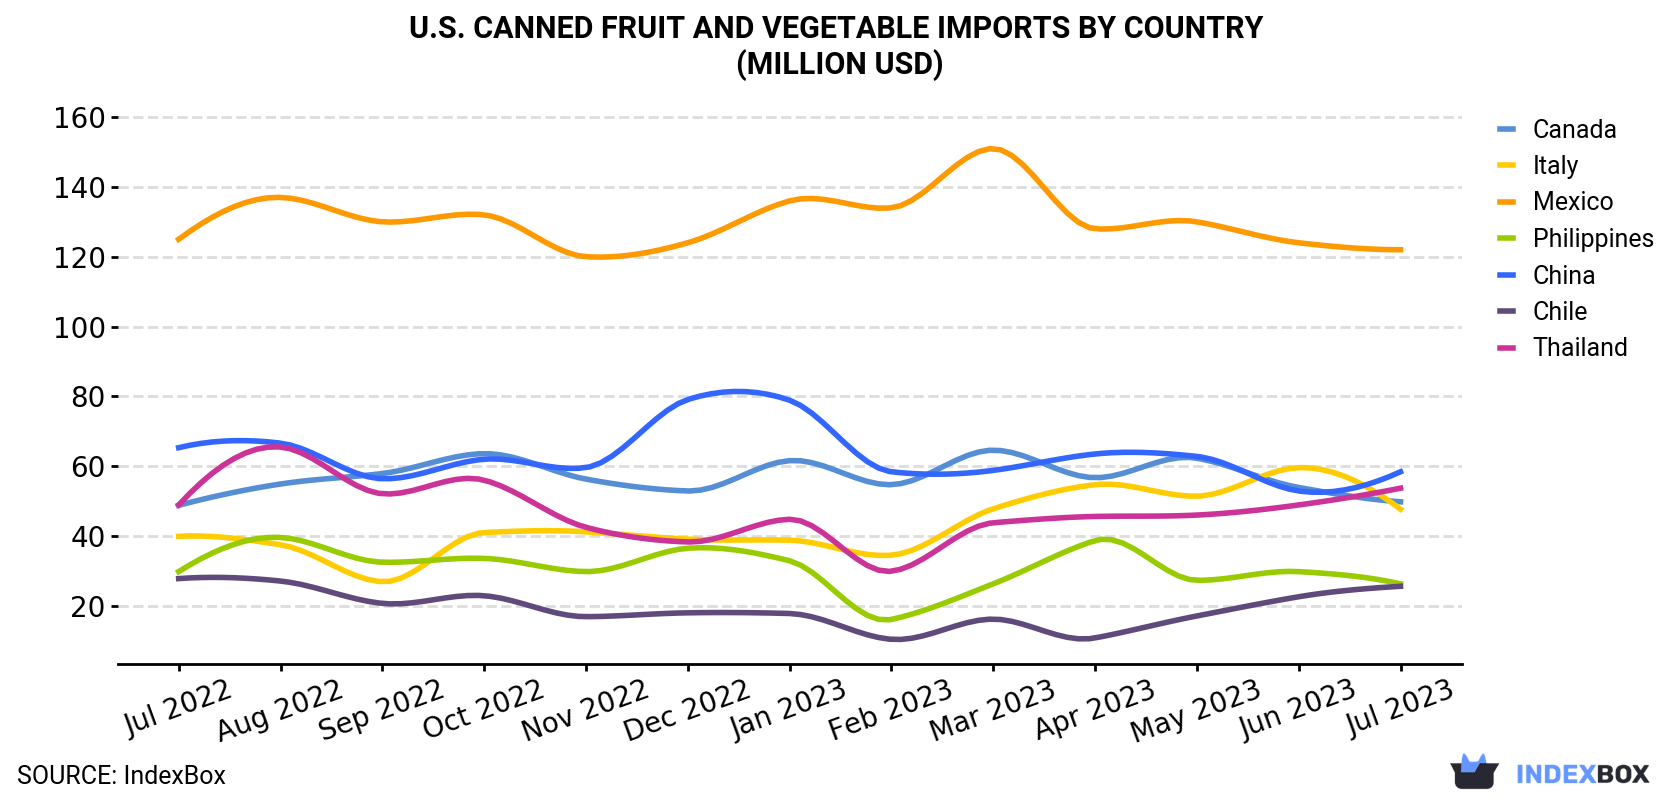
| COUNTRY | Import Value of Canned Fruit And Vegetable in U.S. (million USD) | ||||||||||||
|---|---|---|---|---|---|---|---|---|---|---|---|---|---|
| Jul 2022 | Aug 2022 | Sep 2022 | Oct 2022 | Nov 2022 | Dec 2022 | Jan 2023 | Feb 2023 | Mar 2023 | Apr 2023 | May 2023 | Jun 2023 | Jul 2023 | |
| Mexico | 125 | 137 | 130 | 132 | 120 | 124 | 136 | 134 | 151 | 128 | 130 | 124 | 122 |
| China | 65.3 | 66.6 | 56.4 | 62.0 | 59.6 | 79.1 | 78.9 | 58.4 | 58.8 | 63.5 | 62.8 | 52.9 | 58.4 |
| Thailand | 48.9 | 65.5 | 52.1 | 56.0 | 42.5 | 38.3 | 44.8 | 29.9 | 43.8 | 45.6 | 46.0 | 48.9 | 53.7 |
| Canada | 48.8 | 54.9 | 57.9 | 63.6 | 56.3 | 52.9 | 61.6 | 54.7 | 64.6 | 56.7 | 62.3 | 53.9 | 49.8 |
| Italy | 39.9 | 37.5 | 26.9 | 41.0 | 41.2 | 39.1 | 38.8 | 34.5 | 47.8 | 54.7 | 51.4 | 59.6 | 47.7 |
| Philippines | 29.8 | 39.6 | 32.5 | 33.6 | 29.8 | 36.5 | 32.9 | 16.1 | 26.3 | 38.7 | 27.3 | 29.8 | 26.3 |
| Chile | 27.8 | 27.1 | 20.7 | 22.9 | 16.9 | 18.0 | 17.8 | 10.4 | 16.2 | 10.8 | 17.1 | 22.6 | 25.6 |
| Others | 348 | 387 | 335 | 439 | 390 | 394 | 380 | 327 | 384 | 397 | 427 | 386 | 365 |
| Total | 733 | 815 | 712 | 850 | 756 | 782 | 790 | 665 | 793 | 794 | 825 | 777 | 748 |
Imports by Country
Mexico (51K tons), China (44K tons) and Thailand (34K tons) were the main suppliers of canned fruit and vegetable imports to the United States, together accounting for 31% of total imports.
From July 2022 to July 2023, the most notable rate of growth in terms of purchases, amongst the main suppliers, was attained by Thailand (with a CAGR of +0.5%), while imports for the other leaders experienced mixed trend patterns.
In value terms, Mexico ($122M) constituted the largest supplier of canned fruit and vegetable to the United States, comprising 16% of total imports. The second position in the ranking was taken by China ($58M), with a 7.8% share of total imports. It was followed by Thailand, with a 7.2% share.
From July 2022 to July 2023, the average monthly rate of growth in terms of value from Mexico was relatively modest. The remaining supplying countries recorded the following average monthly rates of imports growth: China (-0.9% per month) and Thailand (+0.8% per month).
Import Prices by Country
In July 2023, the canned fruit and vegetable price stood at $1,790 per ton (CIF, US), rising by 5.4% against the previous month. Overall, the import price recorded a relatively flat trend pattern. The pace of growth appeared the most rapid in September 2022 when the average import price increased by 15% against the previous month. Over the period under review, average import prices attained the maximum in July 2023.
Prices varied noticeably by the country of origin: the country with the highest price was Canada ($3,020 per ton), while the price for Brazil ($679 per ton) was amongst the lowest.
From July 2022 to July 2023, the most notable rate of growth in terms of prices was attained by Italy (+5.7%), while the prices for the other major suppliers experienced more modest paces of growth.
This report provides an in-depth analysis of the market for canned fruit and vegetable in the U.S.. Within it, you will discover the latest data on market trends and opportunities by country, consumption, production and price developments, as well as the global trade (imports and exports). The forecast exhibits the market prospects through 2030.
Product coverage:
- NAICS 311421 - Fruit and vegetable canning
Companies mentioned:
- The Schwan Food Company
- Heinz Kraft Foods Company
- Ocean Spray Cranberries
- Seneca Foods Corporation
- Ruiz Food Products
- Welch Foods Inc.
- Pinnacle Foods Group
- Pinnacle Foods Finance
- Red Gold, Amy's Kitchen
- The Stouffer Corporation
- Lakeside Foods
- Tree Top
- Pinnacle Foods
- Tropicana Products
- Pacific Coast Producers
- Knouse Foods Cooperative
- Nestle Prepared Foods
- Landec Corporation
- Hanover Foods Corporation
- Cliffstar
- Bellisio Foods
- Del Monte Foods
- National Grape Co-Operative Association
- H J M P Corp
- TSC Holdings
- Peak Finance Holdings
- Spf Holdings II
Country coverage:
- United States
Data coverage:
- Market volume and value
- Per Capita consumption
- Forecast of the market dynamics in the medium term
- Trade (exports and imports) in the U.S.
- Export and import prices
- Market trends, drivers and restraints
- Key market players and their profiles
Reasons to buy this report:
- Take advantage of the latest data
- Find deeper insights into current market developments
- Discover vital success factors affecting the market
This report is designed for manufacturers, distributors, importers, and wholesalers, as well as for investors, consultants and advisors.
In this report, you can find information that helps you to make informed decisions on the following issues:
- How to diversify your business and benefit from new market opportunities
- How to load your idle production capacity
- How to boost your sales on overseas markets
- How to increase your profit margins
- How to make your supply chain more sustainable
- How to reduce your production and supply chain costs
- How to outsource production to other countries
- How to prepare your business for global expansion
While doing this research, we combine the accumulated expertise of our analysts and the capabilities of artificial intelligence. The AI-based platform, developed by our data scientists, constitutes the key working tool for business analysts, empowering them to discover deep insights and ideas from the marketing data.
-
1. INTRODUCTION
Making Data-Driven Decisions to Grow Your Business
- REPORT DESCRIPTION
- RESEARCH METHODOLOGY AND AI PLATFORM
- DATA-DRIVEN DECISIONS FOR YOUR BUSINESS
- GLOSSARY AND SPECIFIC TERMS
-
2. EXECUTIVE SUMMARY
A Quick Overview of Market Performance
- KEY FINDINGS
- MARKET TRENDS This Chapter is Available Only for the Professional Edition PRO
-
3. MARKET OVERVIEW
Understanding the Current State of The Market and Its Prospects
- MARKET SIZE
- MARKET STRUCTURE
- TRADE BALANCE
- PER CAPITA CONSUMPTION
- MARKET FORECAST TO 2030
-
4. MOST PROMISING PRODUCT
Finding New Products to Diversify Your Business
This Chapter is Available Only for the Professional Edition PRO- TOP PRODUCTS TO DIVERSIFY YOUR BUSINESS
- BEST-SELLING PRODUCTS
- MOST CONSUMED PRODUCT
- MOST TRADED PRODUCT
- MOST PROFITABLE PRODUCT FOR EXPORT
-
5. MOST PROMISING SUPPLYING COUNTRIES
Choosing the Best Countries to Establish Your Sustainable Supply Chain
This Chapter is Available Only for the Professional Edition PRO- TOP COUNTRIES TO SOURCE YOUR PRODUCT
- TOP PRODUCING COUNTRIES
- TOP EXPORTING COUNTRIES
- LOW-COST EXPORTING COUNTRIES
-
6. MOST PROMISING OVERSEAS MARKETS
Choosing the Best Countries to Boost Your Exports
This Chapter is Available Only for the Professional Edition PRO- TOP OVERSEAS MARKETS FOR EXPORTING YOUR PRODUCT
- TOP CONSUMING MARKETS
- UNSATURATED MARKETS
- TOP IMPORTING MARKETS
- MOST PROFITABLE MARKETS
7. PRODUCTION
The Latest Trends and Insights into The Industry
- PRODUCTION VOLUME AND VALUE
8. IMPORTS
The Largest Import Supplying Countries
- IMPORTS FROM 2012–2023
- IMPORTS BY COUNTRY
- IMPORT PRICES BY COUNTRY
9. EXPORTS
The Largest Destinations for Exports
- EXPORTS FROM 2012–2023
- EXPORTS BY COUNTRY
- EXPORT PRICES BY COUNTRY
-
10. PROFILES OF MAJOR PRODUCERS
The Largest Producers on The Market and Their Profiles
This Chapter is Available Only for the Professional Edition PRO -
LIST OF TABLES
- Key Findings In 2023
- Market Volume, In Physical Terms, 2012–2023
- Market Value, 2012–2023
- Per Capita Consumption In 2012-2023
- Imports, In Physical Terms, By Country, 2012–2023
- Imports, In Value Terms, By Country, 2012–2023
- Import Prices, By Country Of Origin, 2012–2023
- Exports, In Physical Terms, By Country, 2012–2023
- Exports, In Value Terms, By Country, 2012–2023
- Export Prices, By Country Of Destination, 2012–2023
-
LIST OF FIGURES
- Market Volume, In Physical Terms, 2012–2023
- Market Value, 2012–2023
- Market Structure – Domestic Supply vs. Imports, In Physical Terms, 2012-2023
- Market Structure – Domestic Supply vs. Imports, In Value Terms, 2012-2023
- Trade Balance, In Physical Terms, 2012-2023
- Trade Balance, In Value Terms, 2012-2023
- Per Capita Consumption, 2012-2023
- Market Volume Forecast to 2030
- Market Value Forecast to 2030
- Products: Market Size And Growth, By Type
- Products: Average Per Capita Consumption, By Type
- Products: Exports And Growth, By Type
- Products: Export Prices And Growth, By Type
- Production Volume And Growth
- Exports And Growth
- Export Prices And Growth
- Market Size And Growth
- Per Capita Consumption
- Imports And Growth
- Import Prices
- Production, In Physical Terms, 2012–2023
- Production, In Value Terms, 2012–2023
- Imports, In Physical Terms, 2012–2023
- Imports, In Value Terms, 2012–2023
- Imports, In Physical Terms, By Country, 2023
- Imports, In Physical Terms, By Country, 2012–2023
- Imports, In Value Terms, By Country, 2012–2023
- Import Prices, By Country Of Origin, 2012–2023
- Exports, In Physical Terms, 2012–2023
- Exports, In Value Terms, 2012–2023
- Exports, In Physical Terms, By Country, 2023
- Exports, In Physical Terms, By Country, 2012–2023
- Exports, In Value Terms, By Country, 2012–2023
- Export Prices, By Country Of Destination, 2012–2023


