
U.S. Photographic Film, Paper, Plate, And Chemical Market. Analysis And Forecast to 2030
Get instant access to more than 2 million reports, dashboards, and datasets on the IndexBox Platform.
View PricingJuly 2023 Witnesses a 4% Decline As United States' Photographic Film Export Plunges to $116M.
U.S. Photographic Film Exports
In July 2023, the amount of photographic film, paper, plate, and chemical exported from the United States stood at 4.4K tons, flattening at the previous month's figure. Over the period under review, exports, however, showed a mild contraction. The growth pace was the most rapid in February 2023 with an increase of 9.5% m-o-m.
In value terms, photographic film exports contracted slightly to $116M (IndexBox estimates) in July 2023. In general, exports, however, showed a relatively flat trend pattern. The pace of growth appeared the most rapid in October 2022 with an increase of 9% m-o-m. As a result, the exports attained the peak of $135M. From November 2022 to July 2023, the growth of the exports remained at a somewhat lower figure. 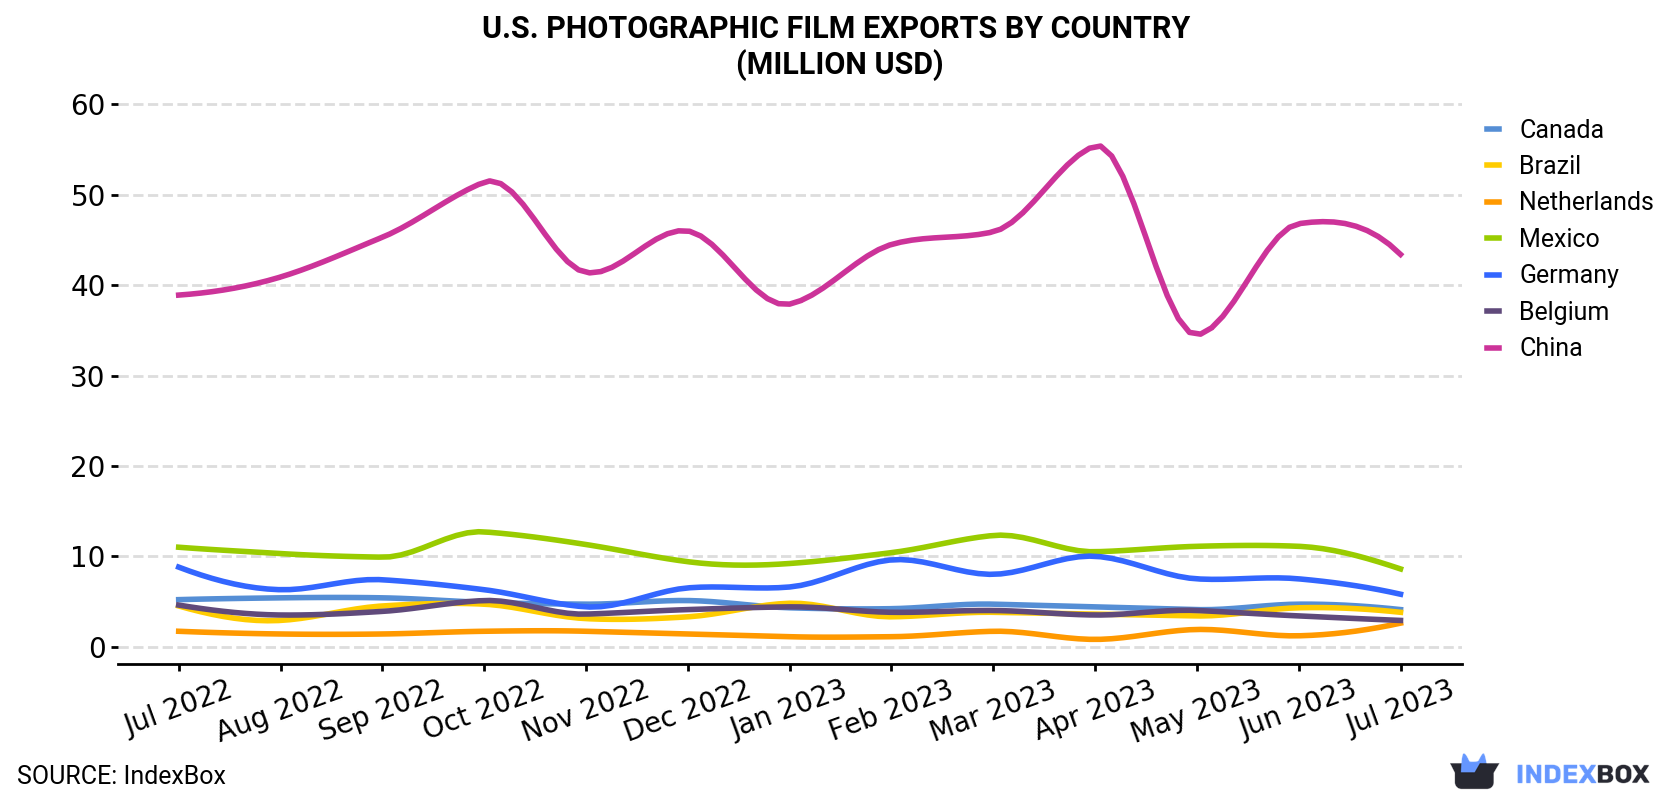
| COUNTRY | Export Value of Photographic Film in U.S. (million USD) | ||||||||||||
|---|---|---|---|---|---|---|---|---|---|---|---|---|---|
| Jul 2022 | Aug 2022 | Sep 2022 | Oct 2022 | Nov 2022 | Dec 2022 | Jan 2023 | Feb 2023 | Mar 2023 | Apr 2023 | May 2023 | Jun 2023 | Jul 2023 | |
| China | 38.9 | 40.9 | 45.3 | 51.4 | 41.4 | 46.0 | 37.9 | 44.5 | 45.9 | 55.4 | 34.5 | 46.8 | 43.4 |
| Mexico | 11.0 | 10.3 | 9.9 | 12.7 | 11.3 | 9.4 | 9.2 | 10.4 | 12.3 | 10.5 | 11.1 | 11.1 | 8.6 |
| Germany | 8.8 | 6.3 | 7.4 | 6.3 | 4.4 | 6.5 | 6.6 | 9.6 | 8.0 | 10.0 | 7.5 | 7.5 | 5.8 |
| Canada | 5.2 | 5.4 | 5.4 | 4.9 | 4.7 | 5.1 | 4.3 | 4.2 | 4.7 | 4.4 | 4.1 | 4.7 | 4.1 |
| Brazil | 4.5 | 2.9 | 4.5 | 4.7 | 3.1 | 3.3 | 4.8 | 3.3 | 3.8 | 3.6 | 3.4 | 4.3 | 3.8 |
| Belgium | 4.6 | 3.5 | 3.9 | 5.1 | 3.6 | 4.1 | 4.4 | 3.8 | 4.0 | 3.5 | 4.0 | 3.4 | 2.9 |
| Netherlands | 1.7 | 1.4 | 1.4 | 1.7 | 1.7 | 1.4 | 1.1 | 1.1 | 1.7 | 0.8 | 1.9 | 1.2 | 2.6 |
| Others | 53.9 | 49.9 | 46.2 | 48.3 | 44.5 | 45.8 | 41.0 | 40.7 | 41.3 | 42.1 | 47.0 | 40.8 | 44.5 |
| Total | 129 | 121 | 124 | 135 | 115 | 122 | 109 | 118 | 122 | 130 | 114 | 120 | 116 |
Exports by Country
China (1K tons) was the main destination for photographic film exports from the United States, accounting for a 23% share of total exports. Moreover, photographic film exports to China exceeded the volume sent to the second major destination, Mexico (447 tons), twofold. The third position in this ranking was taken by the Netherlands (375 tons), with an 8.5% share.
From July 2022 to July 2023, the average monthly rate of growth in terms of volume to China stood at -3.0%. Exports to the other major destinations recorded the following average monthly rates of exports growth: Mexico (-3.3% per month) and the Netherlands (+0.5% per month).
In value terms, China ($43M) remains the key foreign market for photographic film exports from the United States, comprising 38% of total exports. The second position in the ranking was taken by Mexico ($8.6M), with a 7.4% share of total exports. It was followed by Germany, with a 5% share.
From July 2022 to July 2023, the average monthly growth rate of value to China was relatively modest. Exports to the other major destinations recorded the following average monthly rates of exports growth: Mexico (-2.1% per month) and Germany (-3.4% per month).
Export Prices by Country
In July 2023, the photographic film price amounted to $26,168 per ton (FOB, US), shrinking by -4.9% against the previous month. In general, the export price, however, saw a relatively flat trend pattern. The growth pace was the most rapid in December 2022 when the average export price increased by 25% against the previous month. The export price peaked at $28,113 per ton in April 2023; however, from May 2023 to July 2023, the export prices failed to regain momentum.
Prices varied noticeably by the country of destination: the country with the highest price was China ($42,901 per ton), while the average price for exports to France ($3,963 per ton) was amongst the lowest.
From July 2022 to July 2023, the most notable rate of growth in terms of prices was recorded for supplies to China (+4.0%), while the prices for the other major destinations experienced more modest paces of growth.
This report provides an in-depth analysis of the photographic film market in the U.S.. Within it, you will discover the latest data on market trends and opportunities by country, consumption, production and price developments, as well as the global trade (imports and exports). The forecast exhibits the market prospects through 2030.
Product coverage:
- NAICS 325992 - Photographic film, paper, plate, and chemical manufacturing
Companies mentioned:
- Eastman Kodak Company
- Ikonics Corporation
- Horizons Incorporated
- Wbi
- Cyber Graphics
- Lasermasters
- Innovia Films
- Color Imaging
- Fujifilm Hunt Chemicals U.S.A.
- Ulano Corporation
- Truesense Imaging
- Ad Color
- Printing Technologies
- Raven Industries
- Advance Reproductions Corp
- Oce-USA Holding
- Konica Minolta Supplies Manufacturing U.S.A.
- Hoya Holdings
- Mvm Products
- Canon Environmental Technologies
- Energy Storage Corp
- Owen Stephens Productions
- International Communication Materials
- Gpc International
- Champion Photochemistry
- Black Bayou Productions
- James Colucci Enterprises
- Zink Holdings
Country coverage:
- United States
Data coverage:
- Market volume and value
- Per Capita consumption
- Forecast of the market dynamics in the medium term
- Trade (exports and imports) in the U.S.
- Export and import prices
- Market trends, drivers and restraints
- Key market players and their profiles
Reasons to buy this report:
- Take advantage of the latest data
- Find deeper insights into current market developments
- Discover vital success factors affecting the market
This report is designed for manufacturers, distributors, importers, and wholesalers, as well as for investors, consultants and advisors.
In this report, you can find information that helps you to make informed decisions on the following issues:
- How to diversify your business and benefit from new market opportunities
- How to load your idle production capacity
- How to boost your sales on overseas markets
- How to increase your profit margins
- How to make your supply chain more sustainable
- How to reduce your production and supply chain costs
- How to outsource production to other countries
- How to prepare your business for global expansion
While doing this research, we combine the accumulated expertise of our analysts and the capabilities of artificial intelligence. The AI-based platform, developed by our data scientists, constitutes the key working tool for business analysts, empowering them to discover deep insights and ideas from the marketing data.
-
1. INTRODUCTION
Making Data-Driven Decisions to Grow Your Business
- REPORT DESCRIPTION
- RESEARCH METHODOLOGY AND AI PLATFORM
- DATA-DRIVEN DECISIONS FOR YOUR BUSINESS
- GLOSSARY AND SPECIFIC TERMS
-
2. EXECUTIVE SUMMARY
A Quick Overview of Market Performance
- KEY FINDINGS
- MARKET TRENDS This Chapter is Available Only for the Professional Edition PRO
-
3. MARKET OVERVIEW
Understanding the Current State of The Market and Its Prospects
- MARKET SIZE
- MARKET STRUCTURE
- TRADE BALANCE
- PER CAPITA CONSUMPTION
- MARKET FORECAST TO 2030
-
4. MOST PROMISING PRODUCT
Finding New Products to Diversify Your Business
This Chapter is Available Only for the Professional Edition PRO- TOP PRODUCTS TO DIVERSIFY YOUR BUSINESS
- BEST-SELLING PRODUCTS
- MOST CONSUMED PRODUCT
- MOST TRADED PRODUCT
- MOST PROFITABLE PRODUCT FOR EXPORT
-
5. MOST PROMISING SUPPLYING COUNTRIES
Choosing the Best Countries to Establish Your Sustainable Supply Chain
This Chapter is Available Only for the Professional Edition PRO- TOP COUNTRIES TO SOURCE YOUR PRODUCT
- TOP PRODUCING COUNTRIES
- TOP EXPORTING COUNTRIES
- LOW-COST EXPORTING COUNTRIES
-
6. MOST PROMISING OVERSEAS MARKETS
Choosing the Best Countries to Boost Your Exports
This Chapter is Available Only for the Professional Edition PRO- TOP OVERSEAS MARKETS FOR EXPORTING YOUR PRODUCT
- TOP CONSUMING MARKETS
- UNSATURATED MARKETS
- TOP IMPORTING MARKETS
- MOST PROFITABLE MARKETS
7. PRODUCTION
The Latest Trends and Insights into The Industry
- PRODUCTION VOLUME AND VALUE
8. IMPORTS
The Largest Import Supplying Countries
- IMPORTS FROM 2012–2023
- IMPORTS BY COUNTRY
- IMPORT PRICES BY COUNTRY
9. EXPORTS
The Largest Destinations for Exports
- EXPORTS FROM 2012–2023
- EXPORTS BY COUNTRY
- EXPORT PRICES BY COUNTRY
-
10. PROFILES OF MAJOR PRODUCERS
The Largest Producers on The Market and Their Profiles
This Chapter is Available Only for the Professional Edition PRO -
LIST OF TABLES
- Key Findings In 2023
- Market Volume, In Physical Terms, 2012–2023
- Market Value, 2012–2023
- Per Capita Consumption In 2012-2023
- Imports, In Physical Terms, By Country, 2012–2023
- Imports, In Value Terms, By Country, 2012–2023
- Import Prices, By Country Of Origin, 2012–2023
- Exports, In Physical Terms, By Country, 2012–2023
- Exports, In Value Terms, By Country, 2012–2023
- Export Prices, By Country Of Destination, 2012–2023
-
LIST OF FIGURES
- Market Volume, In Physical Terms, 2012–2023
- Market Value, 2012–2023
- Market Structure – Domestic Supply vs. Imports, In Physical Terms, 2012-2023
- Market Structure – Domestic Supply vs. Imports, In Value Terms, 2012-2023
- Trade Balance, In Physical Terms, 2012-2023
- Trade Balance, In Value Terms, 2012-2023
- Per Capita Consumption, 2012-2023
- Market Volume Forecast to 2030
- Market Value Forecast to 2030
- Products: Market Size And Growth, By Type
- Products: Average Per Capita Consumption, By Type
- Products: Exports And Growth, By Type
- Products: Export Prices And Growth, By Type
- Production Volume And Growth
- Exports And Growth
- Export Prices And Growth
- Market Size And Growth
- Per Capita Consumption
- Imports And Growth
- Import Prices
- Production, In Physical Terms, 2012–2023
- Production, In Value Terms, 2012–2023
- Imports, In Physical Terms, 2012–2023
- Imports, In Value Terms, 2012–2023
- Imports, In Physical Terms, By Country, 2023
- Imports, In Physical Terms, By Country, 2012–2023
- Imports, In Value Terms, By Country, 2012–2023
- Import Prices, By Country Of Origin, 2012–2023
- Exports, In Physical Terms, 2012–2023
- Exports, In Value Terms, 2012–2023
- Exports, In Physical Terms, By Country, 2023
- Exports, In Physical Terms, By Country, 2012–2023
- Exports, In Value Terms, By Country, 2012–2023
- Export Prices, By Country Of Destination, 2012–2023


